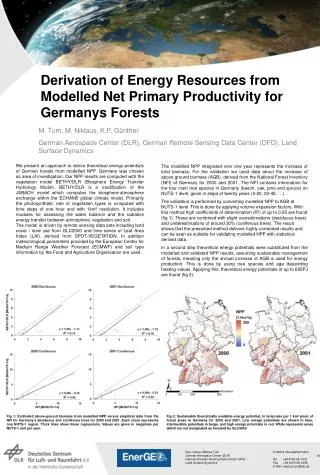
Coherence of Net Primary Productivity Estimates
210 likes | 325 Vues
Coherence of Net Primary Productivity Estimates. Keala Hagmann Mark Harmon: carbon dynamics, scalability Don Henshaw: database and people management Howard Bruner: reference stand data & NPP Suzanne Remillard: reference stand data & NPP Gody Spycher: data manipulation.

Coherence of Net Primary Productivity Estimates
E N D
Presentation Transcript
Coherence of Net Primary Productivity Estimates Keala HagmannMark Harmon: carbon dynamics, scalabilityDon Henshaw: database and people managementHoward Bruner: reference stand data & NPPSuzanne Remillard: reference stand data & NPPGody Spycher: data manipulation
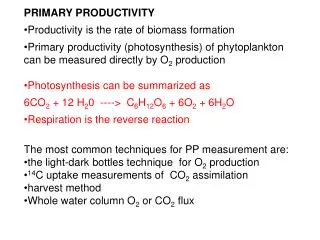
Net Primary Productivity of Live Tree Boles NPPb = ∆Biomass + Mortality
Productivity and Scalability Measure–ability to sequester carbon, sink or source of atmospheric carbonAsk–how scalable are the estimates?Why–refine estimates for carbon cycles; learn more about ecosystem
Objective Identify the spatial scale at which the parts represent the whole
Biomass Estimates: Plot-level Mount Rainier Reference Stands HJ Andrews Reference Stands
NPP Estimates: Plot-level Mount Rainier Reference Stands HJ Andrews Reference Stands
Combinations: 2, 4, 6, 8 plots MRRS, TO11: Adjacent Homogeneity MRRS, AV14: Adjacent Heterogeneity
Biomass & NPP: Stand-level Mount Rainier Reference Stands HJ Andrews Reference Stands Time (Year of Measurement
Future Correlate plots to each otherExtend analysis to stand levelFurther statistical analyses to quantify coherence in trends from site to site
EcoInformatics Potential not exploitedProgrammer & statistician: automate analysis & interpret resultsAnother cross-disciplinary approach to extending comprehension of study subjects and generating insights
Thank You to: Desiree Tullos, Julia Jones, Kari O’Connell and Fred Swanson for creating EISI and for hosting us.Nicole Czarmonski and Jorge Ramirez for guidance and encouragement. The numerous lecturers who gave of their time and shared their knowledge.Alan Tepley for providing an opportunity for fieldwork in incredibly beautiful forests and for all that he teaches.