Download
1 / 16
160 likes | 176 Vues
Learn how to graph and solve inequalities in one variable using step-by-step instructions and examples. Understand the principles of inequalities, graphing on a number line, and finding solutions. Practice problems included for better understanding.

E N D
6-1 and 6-2 Solving Inequalities Algebra 1 Glencoe McGraw-Hill
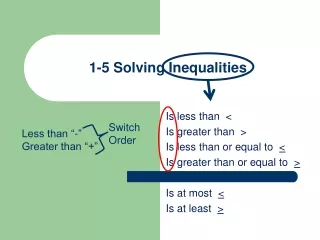
The graph of an inequality in one variable is the set of points on a number line that represent allsolutions of the inequality. endpoint 4 • ray O If the endpoint on the graph is not a solution, draw an open dot. If the endpoint on the graph is a solution, draw a solid dot. Then draw an arrowhead to show that the graph continues to infinity. What is the name for the geometric figure that represents the solution?
Graphing an Inequality in One Variable 7> x 1. Write inequality. Rewrite with variable first. x <7 7 2. Draw a line (use arrowheads). • 3. Draw open or solid dot and label the endpoint. 4. Draw the ray in the direction of the inequality symbol.
A solution of an inequality is a value for the variable that makes the inequality true. You can add or subtract inequalities just like you add or subtract equations. To solve an inequality isolate the variable on one side of the inequality symbol. Follow the basic rule: Whatever you do to one side of the inequality sign, you must also do to the other side of the inequality sign.
Solvex– 6 >–14. Then graph the solution. Write the inequality. Isolate the variable using inverse operations. –8 • Graph.
Solvex– 6 >–14. Then graph the solution. Write the inequality. Isolate the variable using inverse operations. • Graph. –8 How many solutions are there to an inequality problem? Infinite
Solvex– 6 >–14. Then graph the solution. Write the inequality. Isolate the variable using inverse operations. • Graph. –8
Solve. Then graph the solution. Example 1 Example 2 Example 3 Example 4 Example 5 Example 6 Write an inequality and then solve. Forty is no greater than the difference of a number and two.
Solve. Then graph the solution. Example 1 58 • Example 2 8 O Did you draw an open dot?
Solve. Then graph the solution. Example 3 26.025 • Example 4 •
Solve. Then graph the solution. Example 5 7 O Ex. 6 Forty is no greater than the difference of a number and two. <
Multiplication and Division Properties of Inequalities If you multiply or divide each side of an inequality by a positive number, the direction of the inequality symbol isunchanged. If you multiply or divide each side of an inequality by a negative number, the direction of the inequality symbol isreversed. /
Solve Write the inequality. Use inverse property. / When you multiply or divide by a negative, reverseinequality symbol. >
Solve. Ex. 7 Ex. 8 Ex. 10 Ex. 9 Write an inequality and then solve. Ex. 11 Negative three eighths times a number is greater than or equal to 12. Find the number. Ex. 12 Two and one half times a number is less than one and one fifth. Find the number.
Solve. Ex. 7 Ex. 8 / > Ex. 10 Ex. 9 / >
Ex. 11 Negative three eighths times a number is greater than or equal to 12. > / < Ex. 12 Two and one half times a number is less than one and one fifth. <