Network Management Tools Presentations
Network Management Tools Presentations. Saturday-Monday, Sept. 18-20, 2004, 6:30 PM CSE 552 – Network Management Fall 2004 (Term 041) Assignment 1. Schedule of Presentations. Network Management Tool with PRTG. What is PRTG. What PRTG can do for you. How PRTG works.

Network Management Tools Presentations
E N D
Presentation Transcript
Network Management ToolsPresentations Saturday-Monday, Sept. 18-20, 2004, 6:30 PM CSE 552 – Network Management Fall 2004 (Term 041) Assignment 1
Network Management Tool with PRTG What is PRTG. What PRTG can do for you. How PRTG works. How to configure PRTG. 1. Add a new sensor. 2. Access Sensor Data. 3. Sensor Settings. 4. Setting PRTG Program Options.
Network Analyzer(WinDump) By Mohammed Aijaz Mohiuddin #230417
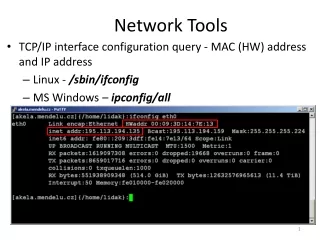
Brief Overview of Network Analyzer • It is GUI interface to command line tool windump(on windows). • Functions:- • 1) Capture and display network packets • 2) Display packets stored in a file • 3) Capture network statistics • 4) Perform real-time network monitoring • Requirement:- • WinPcap Driver. This driver allows most types of network cards to be placed in promiscuous mode. • Input:- user activity.
What more can be done…… Some of Many are as follows.. • Can capture the traffic of a specific host or specific subnet • Some PCs may have multiple interfaces. Traffic on a specific interface can also be obtained. • Incoming traffic to a host or Outgoing traffic from a host or Both can be captured. • Can store the result to a dump file for later purpose. • Thank you.
CyberGauge By Saeed Bawazir Abdullah Basalamah CSE 552 Network Management Tool
Agenda • Overview of CyberGauge Network Management Tool • Uses of the Tool and Examples • Conclusion
Overview • Windows-based Application Neon Software, Inc • Monitor switches, routers, hubs, servers…. Etc. • SNMP and MIB II • Automatically create: • utilization graphs • daily, weekly, and monthly quality of service (QoS), • Receive alerts for both non-responsive devices and traffic thresholds • Monitor 5, 10, 20 or 100 devices
How it works • sends an SNMP query over network to router's MIB • Several SNMP queries were sent to the router to compile a list of the network interfaces present on that router, along with each interface's maximum speed and its type. • another SNMP query was sent to obtain the router's name, type, location, how long the router had been running, and the person responsible for maintaining the router. • determine how much bandwidth was consumed during the Monitoring Rate interval, and calculates the percentage of the total bandwidth available
Uses of the Tool (Device Information) • CyberGauge Provides the troubleshooter: • Name, Type & Location of network device • Uptime • Number of interfaces.(useable/unuseable) • Party responsible for device
Uses of the Tool (Interface Information) • For each interface: • Interface name • VLAN • IP address • Type of network connection (Ethernet,..) • Max. speed (not actual) • Status
Uses of the Tool By CyberGauge: CCSE Primary Switch Device & Interfaces Information
Uses of the Tool (Performance Management) Monitor Network Connectivity: • Throughput • Link Utilization • Statistics Collection
Examples (CCSE – ITC) The IP address used: 196.1.65.253 Interfaces Statistics
Examples (CCSE – ITC) CyberGauge: IN/OUT Throughput for Up Link CCSE-ITC MRTG: IN/OUT Throughput for Up Link CCSE-ITC
Examples (CCSE – ITC) All Interfaces Can be Monitored
Examples (Local Company) IN/OUT Utilization for 128K Leased Line
Examples (Report Generation – CCSE Interface) • Report can also be generated as the device and interface is specified. • Sample Test for an interface in CCSE Switch: • Date Time IN (Kbps) OUT (Kbps) • 09/15/04 11:33:28 252.9 82.4 • 09/15/04 11:33:43 236.1 61.1 • 09/15/04 11:33:58 161.9 48.8 • 09/15/04 11:34:13 184.8 36.7 • 09/15/04 11:34:28 67.6 108.4 • 09/15/04 11:34:43 202.2 28.2 • 09/15/04 11:34:58 283.9 134.3 • 09/15/04 11:35:13 336.3 66.5 • 09/15/04 11:35:28 179.0 119.6 • 09/15/04 11:35:43 223.8 52.1 • 09/15/04 11:35:58 615.9 39.4
Conclusion • CyberGauge… • Utility for monitoring bandwidth information from any SNMP-based device • Answer critical questions: ·How much of my Internet bandwidth am I currently using? ·Are slowdowns in Internet access related to increased use of my Internet connection? ·Am I getting the bandwidth promised by my Internet Service Provider (ISP)?
MRTG Baher Al-Ramady 978504
OUTLINE • What is MRTG • How it works • How to use it. • Example 1 • Example 2.
Multi Router Traffic Grapher • Monitor the traffic load on network-links. • Open Source Code. Perl & C. • SNMPv1 & SNMPv2. • Visual representations of the traffic.
How MRTG Works • SNMP request. • Log the response. • File size does not increase. • Graph the polled data.
How to use it • IP, Community & OID. • SNMP Agent. • perl cfgmaker [options] [community@]router1 • cfgmaker public@10.221.0.65 • Make .cfg file. • Workdir: d:\inetpub\wwwroot\ • Interval: 5 • RunAsDaemon: Yes
Example 1 (Cat3550-335-1145 in 22-335-1 ) Standard Interface MIB
Example 2 1.3.6.1.2.1.31.1.1.1.6.index
Function • This VisualRoute Server provides a graphical traceroute from this server to any other network device you choose, useful for pinpointing network connectivity problems and identifying IP addresses. • VisualRoute Personal Edition combines essential networking utilities, including traceroute, ping, WHOIS, and reverse DNS, to determine precisely where and how traffic is flowing on an Internet connection, providing a geographical map of the route and the performance of each segment.
VisualRoute Features • See actual IP address locations - identifies the physical city/country location of IP addresses -- which is often quite different from the IP registration location -- and shows the path of an Internet connection on a global map. • Worldwide WHOIS reporting - get instant domain and network registration information from worldwide databases, so you can easily report a network problem or investigate an IP address.
VisualRoute Features • Internet connectivity analysis - answers the question "Why can't I get there from here?" by providing an analysis of the Internet from where you are to where you want to go. VisualRoute will help you to determine if a connectivity problem is due to your ISP, the Internet, or the host you are trying to reach, and pinpoints which network (ie. WorldCom, Verio, Ebone, MSN) a problem is in. • Automated ping reporting - the Ping Grapher tool continuously monitors the response time of a network host. • Application port testing - reports the availability of popular IP services including POP3, FTP and SMNP.