Download
1 / 1
10 likes | 134 Vues
Center of Excellence. www.scidesign.org. Sharing Resources to Advance Research and Education through Cyber-infrastructure. Visualization Queries:. A Declarative Approach To Generating Visualizations Using the Semantic Web. ED. X-INF. Nicholas Del Rio and Paulo Pinheiro da Silva . ES.

E N D
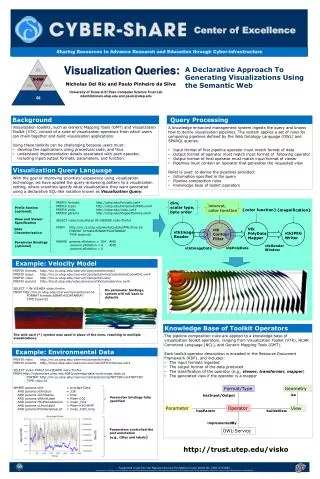
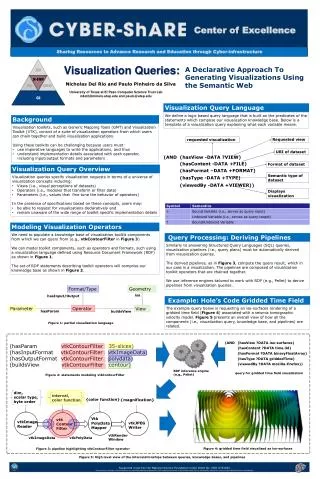
Center of Excellence www.scidesign.org Sharing Resources to Advance Research and Education through Cyber-infrastructure Visualization Queries: A Declarative Approach To Generating Visualizations Using the Semantic Web ED X-INF Nicholas Del Rio and Paulo Pinheiroda Silva ES GEO University of Texas at El Paso Computer Science Trust Lab ndel2@miners.utep.edu and paulo@utep.edu CI Visualization Query Language We define a logic based query language that is built on the predicates of the statements which compose our visualization knowledge base. Below is a template of a visualization query explaining what each variable means. Background • Visualization toolkits, such as Generic Mapping Tools (GMT) and Visualization Toolkit (VTK), consist of a suite of visualization operators from which users can chain together and build visualization applications. • Using these toolkits can be challenging because users must: • use imperative languages to write the applications, and thus • understand implementation details associated with each operator, including input/output formats and parameters Requested view requested visualization URI of dataset Format of dataset Visualization Query Overview Semantic type of dataset • Visualization queries specify visualization requests in terms of a universe of visualization concepts including: • Views (i.e., visual perceptions of datasets) • Operators (i.e., modules that transform or filter data) • Parameters (i.e., values that fine tune the behavior of operators) • In the presence of specifications based on these concepts, users may: • be able to request for visualizations declaratively and • remain unaware of the wide range of toolkit specific implementation details Displays visualization Modeling Visualization Operators • We need to populate a knowledge base of visualization toolkit components from which we can query from (e.g., vtkContourFilter in Figure 3) • We can model toolkit components, such as operators and formats, such using a visualization language defined using Resource Document Framework (RDF) as shown in Figure 1. • The set of RDF statements describing toolkit operators will comprise our knowledge baseas shown in Figure 2. Query Processing: Deriving Pipelines Similarly to answering Structured Query Languages (SQL) queries, visualization pipelines (i.e., query plans) must be automatically derived from visualization queries. The derived pipelines, as in Figure 3, compute the query result, which in our case is a visualization. The pipelines are composed of visualization toolkit operators that are chained together. We use inference engines tailored to work with RDF (e.g., Pellet) to derive pipelines from visualization queries. Geometry Format/Type isa hasInput/Output Operator Parameter View hasParam buildsView Example: Hole’s Code Gridded Time Field The example query below is requesting an iso-surfaces rendering of a gridded time field (Figure 4) associated with a seismic tomographic velocity model. Figure 5 presents an overall view of how all the components (i.e., visualization query, knowledge base, and pipelines) are related. (hasParamvtkContourFilter 35-slices) (hasInputFormatvtkContourFiltervtkImageData) (hasOutputFormatvtkContourFilterpolydata) (buildsViewvtkContourFilter contour) Figure 1: partial visualization language dim, scalar type, byte order interval, color function RDF inference engine (e.g., Pellet) {color function} {magnification} query for gridded time field visualization Figure 2: statements modeling vtkContourFilter Vtk PolyData Mapper vtk Contour Filter vtkImage Reader vtkJPEG Writer vtkRender Window vtkPolyData vtkImageData Figure 4: gridded time field visualized as iso-surfaces Figure 3: pipeline highlighting vtkContourFilter operator Figure 5: High level view of the interrelationships between queries, knowledge bases, and pipelines Supported in part by the National Science Foundation under Grant No. HRD-0734825. Any opinions, findings, and conclusions or recommendations expressed in this material are those of the authors and do not necessarily reflect the views of the National Science Foundation.