Download
1 / 8
80 likes | 231 Vues
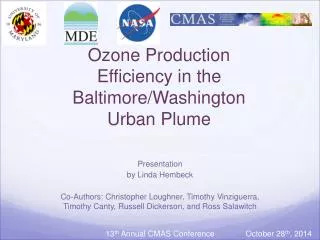
Estimatin g Ozone Production Efficiency from Space. Matthew Cooper 1 , Randall Martin 1,2 , Bastien Sauvage 3 , Chris Boone 4 , Kaley Walker 4,5 ,Peter Bernath 4,6 , Chris McLinden 7 , Doug Degenstein 8 , Andreas Volz-Thomas 9 , Catherine Wespes 10

E N D
EstimatingOzone Production Efficiency from Space Matthew Cooper1, Randall Martin1,2, Bastien Sauvage3, Chris Boone4, Kaley Walker4,5,Peter Bernath4,6, Chris McLinden7, Doug Degenstein8, Andreas Volz-Thomas9, Catherine Wespes10 5th International GEOS-Chem Meeting Harvard University May 2, 2011
Ozone Production Efficiency Convective outflow: No HNO3, some initial O3, NOx • OPE represents the nonlinear dependence of O3 on NOx • GEOS-Chem predicts high ozone production efficiency • This has not been confirmed by measurements in the tropical troposphere • We can estimate OPE using satellite retrievals of O3 and HNO3 concentrations
Observations ACE-FTS • Solar occultation instrument measuring IR • Global coverage in tropics over several years (2004-2010) • Measures O3, HNO3, 30+ others • Evaluation against aircraft, ozonesondes [Cooper et al., JGR, in press] • 10-13% high bias for O3 • 15% for HNO3 Aircraft • PEM Tropics A (1996) and B (1999) • PRE-AVE (2004) and CR-AVE (2006) • Tropospheric O3 and HNO3 observations between 8-12 km used here
Testing the Method using GEOS-Chem • How does calculating OPE from concentrations compare to direct calculation from production rates? • Assumed similar O3, HNO3 loss • Some HNO3 scavenging occurs, leads to OPE overestimation • OPE from concentrations is an upper limit estimate!
Ozone Production Efficiency from ACE-FTS ACE-FTS (11.5 km) in Tropics (±20°) • OPE given by slope • OPE = 196 (+34, -61) mol/mol • Agrees with tropical mean OPE from GEOS-Chem (190 mol/mol) • First estimate of OPE using satellite data • Uncertainty sources • Slope error ± 8 • ACE bias ± 5 • Method (upper limit) -53 • Regional pollution ±33
OPE from ACE-FTS, Aircraft and GEOS-Chem Tropics (±20° at 11.5 km) • Over South Pacific region: • GEOS-Chem agree with both data sets within uncertainties GEOS-Chem ACE-FTS Aircraft
OPE Variability 0 50 100 150 200 250 300 Ozone Production Efficiency (mol/mol)
Summary • Estimation of Ozone Production Efficiency possible from ACE-FTS measurements • A new application for satellite measurements • Upper limit tropical mean OPE = 196 (+34,-61) mol/mol using ACE-FTS measurements • In agreement with values calculated from GEOS-Chem output • Regionally defined values possible from ACE-FTS– show same features seen in GEOS-Chem