Download
1 / 17
170 likes | 318 Vues
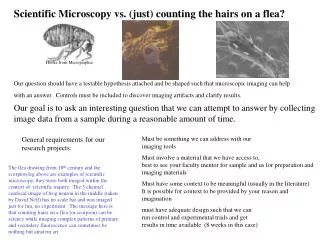
Scientific Microscopy vs. (just) counting the hairs on a flea? . Hooke from Micrographia. Our question should have a testable hypothesis attached and be shaped such that microscopic imaging can help with an answer. Controls must be included to discover imaging artifacts and clarify results. .

E N D
Scientific Microscopy vs. (just) counting the hairs on a flea? Hooke from Micrographia Our question should have a testable hypothesis attached and be shaped such that microscopic imaging can help with an answer. Controls must be included to discover imaging artifacts and clarify results. Our goal is to ask an interesting question that we can attempt to answer by collecting image data from a sample during a reasonable amount of time. General requirements for our research projects: Must be something we can address with our imaging tools Must involve a material that we have access to, best to see your faculty mentor for sample and us for preparation and imaging materials Must have some context to be meaningful (usually in the literature) It is possible for context to be provided by your reason and imagination must have adequate design such that we can run control and experimental trials and get results in time available (8 weeks in this case) The flea drawing from 18th century and the scorpion leg above are examples of scientific microscopy, they were both imaged within the context of scientific inquiry. The 3 channel confocal image of frog neuron in the middle (taken by David Neff) has no scale bar and was imaged just for fun, no experiment. The message here is that counting hairs on a flea (or scorpion) can be science while imaging complex patterns of primary and secondary fluorescence can sometimes be nothing but amateur art.
What do we need from our sample to create a microscopic image Trypanisome parasite Dr Rodrigo Alves De Fonseca:Laboratòrio de Parasitologia, Faculdade de Ciencias da Saùde - Universidade de Brasilia, Brasilia, http://www.olympusmicro.com/galleries/fluorescence/pages/rapiddiagnosismalariasmall.html Sample with some feature (in-homogeneity) of appropriate size to provide contrast Malarial parasite, contrast above derives from fluorescent dye, below from standard histological stain. Red blood cells in each case are only lightly stained. What sample attribute leads to the in-homogeneity in each of these images? http://www.cbc.ca/gfx/photos/malaria_parasite.jpg
The in-homogeneity must be detectable (signal > background or noise high S/N is better) • surface topography • reflectivity /absorption • scattering (diffraction) • secondary signal (electrons, x-rays, fluorescence) • texture (friction, hardness, inter-molecular adhesion) • phase object • electronic or magnetic state, localized charge
Microscopy (imaging) always must involve mapping Microscopy Can involve: Tomography (slice mapping) Metrology (study of Cartesian (geometric) type measurments) Spectroscopy (spectrum viewing) Crystalography (mapping molecular or crystal structure) Morphology (study of shape)
Morphology: the shape of things (scale bar can allow metrology from morphology) Boston U med school histology of the retina webvision.med.utah.edu Flea drawing for Micrographia (Hooke) by Christopher Wren (18th century). SEM of spider silk from MU. Drawing of rabbit sperm by Leeuwenhoek’s scribe (18th century) SEM of sensory organ from fly larva imaged at MU.
Discussions of color vision chemistry Here, in fovea of macula to right outside fovea http://hubel.med.harvard.edu/book/b41.htm http://www.cis.rit.edu/people/faculty/montag/vandplite/pages/chap_9/ch9p1.html blue/green - r blue - cgreen -cred -c This figure shows the sequence for the S-cone pigment compared to that of rhodopsin. The S-cone pigment gene is located on chromosome 7. Notice how different they are. http://www.cis.rit.edu/people/faculty/montag/vandplite/pages/chap_9/ch9p1.html
IN METROLOGY, SCALE BAR IS ALL IMPORTANT Metrology: study of Cartesian measures z HOPG images fromMikroMasch x x&y measurements can be distorted in atomic force microscopy (AFM) by the shape of the scanning tip, z measurements are reliable (AFM of dna with qdots above) Scanning Tunneling Micrograph of graphite seen above. y Monkey skull image from LDI This (bio-film bacteria above) and most scanning electron micrographs have such depth of field that much of the object’s depth appears clearly focused . Why does this make 2D measurements in x & y tricky? Real 3D scale must be stored with 3Dimage data, 2D scale bar cannot be used accurately. This is a surface map of a monkey skull scanned with a laser scanner (above). This (above)and most atomic force micrographs give very accurate measurement in z. This object is much larger than the probe tip so its x/y dimensions are also accurate.
Tomography: mapping a 3D object with 2D data sets (slices) x-ray image data can be analyzed with computer based tomography fluorescence confocal microscope image data can be analyzed with computer based tomography Remember, be careful with use of this scale bar. In this case it can be used only for parts of these images. These are the original 2D confocal images that were reassembled to make the 3D model at right. Double click to see each 2D image sequentially as part of a movie.
2mm Crystalography (mapping atomic or molecular lattice in crystals) Natural diamond crystal from Congo, .7 carats for $40 Crystal lattice of diamond, silicon and germanium. SEM image of diamond film made at MU Ernst Ruska’s paraffin crystal in TEM STM image of Si wafer from http://www.escad-vision.de/2070_Microcracks.aspx http://home.mesastate.edu
10 um counts (#xray photons) x-ray energy (eV) Mapping multiple channels in the same object/image space Spectroscopy Above is 2 channel optical spectroscopy of fly larva, one channel is depicted as green the other is seen as red. www.ornl.gov/sci/ share/msa4micro.html X-ray energies as seen in the spectrum at left can be mapped to regions as seen above iron in spectrum not mapped in this image). This is the inside of an integrated circuit (computer chip)
We must have a way to elicit signal from sample • Probe formation and control • detection of resulting phenomena as probe interacts with sample the above is the job of our microscopes OPTICAL SCOPE AFM CONFOCAL SCAN HEAD SEM
ELECTRON MICROSCOPES AS EXAMPLES OF PROJECTION VS. SCANNING IMAGING SYSTEMS electron source sample electron detector SEM TEM Scanning em Transmission em Image on electron sensitive projection screen Image produced on TV style monitor
What we have here at M.U. SCANNING PROBE MICROSCOPES AFM,MFM, AND NSOM SEM WITH XRAY SPECTROSCOPY CONFOCAL FLUORESCENCE LASER SCANNER (SURFACE IMAGING) TRANSMISSION MICROSCOPES TRANSMITTED LIGHT WITHPHASE/INTERFERENCE CONTRAST AND VISIBLE LIGHT SPECTROSCOPY STANDARD EPI-FLUORESCENCE ALSO WITH VISIBLE LIGHT SPECTROSCOPY TEM
SEM(scanning electron microscope JEOL 5310LV ) high velocity electron beam focused to a spot and scanned across the sample high voltage accelerates electrons to form probe, magnetic lenses scan and focus probe across sample contrast is in variation of secondary (not beam in origin) emissions, x-rays or electrons. This in- homogeneity can arise from shadowing of detector by sample or by actual differences in amount of emission (as in atomic mass contrast) field of view can be as large as 7mmx5mm, sample can be as large as a golf ball the microscope has a stated resolution of ~5nm, our best efforts on highly contrasted samples have demonstrated 15nm resolution probe type probe control types of samples (from where does the contrast arise?) size of viewable field and sample size size of details resolvable
CSLM (confocal scanning laser microscopy BioRad MRC1024 & Leica SP5) coherent laser light focused to a point (spot) on the sample by the objective lens gas lasers (KrAr or Ar) or a selection of solid state lasers emits distinct lines of UV, blue, yellow, red, infrared, etc. light. Mirrors, lenses and optical filters act to form and scan a point (spot) of light over the sample. contrast arises from variation in reflection from sample surface (topography again) or from secondary emissions (fluorescence or phosphorescence). Reflection and some fluorescence is endogenous. We usually image secondary fluorescence, (as opposed to auto-fluorescence) phosphorescence lingers too long for most applications. field of view ranges from 2120 um at 4x no zoom to 8um at 100x zoom10x.. For maximum resolution (most objectives), the sample must be viewed through a coverslip of 170 micron thickness. One can image the surface of any object that fits on the stage. the microscope has a theoretical xy resolution of dxy =(.61 λ) / NA(objective only). About 200-300nm for high NA objective. Z resolution is based on iris size, with optimum confocal iris size: dz = 2λ η / NA2about half the resolution as lateral (600nm). probe type probe control types of samples (from where does the contrast arise?) size of viewable field size of details resolvable
AFM (atomic force microscopy Pacific Nanotechnology NanoR) Probe is an ultrasharp physical object (like a needle). Our probes are usually made of silicon and are fabricated using photo-lithographic techniques. A good (new) tip is very sharp. Probe tip is scanned across the sample surface, standard afm cannot image light but can measure a number of physical parameters. Tip is kept at sample surface (just above) with rapid feedback loop. We’re not just dragging the tip along. Contrast arises from variation in topography, electronic or magnetic variability, different material properties (hardness, resilience, etc.) at sample surface. We use different imaging tips for different types of contrast on the sample. Surface imaging only! Field of view is quite restrictive. 100 microns is the maximum field that we can image in one scan. The object can be much larger than this but must be moved under tip by other means. Object must also be <8um in z. SPM have imaged single atoms with resolution of 0.1 Å, this is shorter than typical bond lengths within molecules probe type probe control types of samples (from where does the contrast arise?) size of viewable field size of details resolvable
3D Laser Scanner (surface mapping laser scanner LDI RPS120) Probe is a low power red laser that has been spread into a two dimensional plane. This plane appears as a contour line as it intersects the sample surface. This line of intersection is defined as ‘the surface’. Laser is formed into plane and scanned across the sample surface. This is acomplished by moving the laser/detector head with a mechanical stage. Pulses from the software are sent to the stage which has 3 axis freedom of movement. The pulse duration (or amplitude) defines how far in x,y, and z the stage will move(specifically, how many turns of a threaded shaft will each motor execute). Contrast does not appear in final images. Rather, contrast is necessary so that we can define surface vs. space (air). Fitting a surface point to a bell shaped distribution of intensities is done with computer. Specular reflection actually hinders accuracy, diffuse is preferable. Field of view for a single scan pass is about 2cm by 2cm by 60cm. These scans can easily be taken serially and registered thereby ‘knitting’ together fields. Sample can be no more than 10cm in z or 60cm in x and must fit into room in y. Our laser scanner has a mechanical step size of 10 microns and pixel resolution of about 20 microns. probe type probe control types of samples (from where does the contrast arise?) size of viewable field size of details resolvable