Download
1 / 10
100 likes | 117 Vues
Chemically, Lenalidomide is a thalidomide analog and consider as a novel oral immune modulatory drug and having numerous pharmacological activities like antineoplastic, antiangiogenic, pro-erythropoietic and immunomodulatory effect with improved toxicity profile

E N D
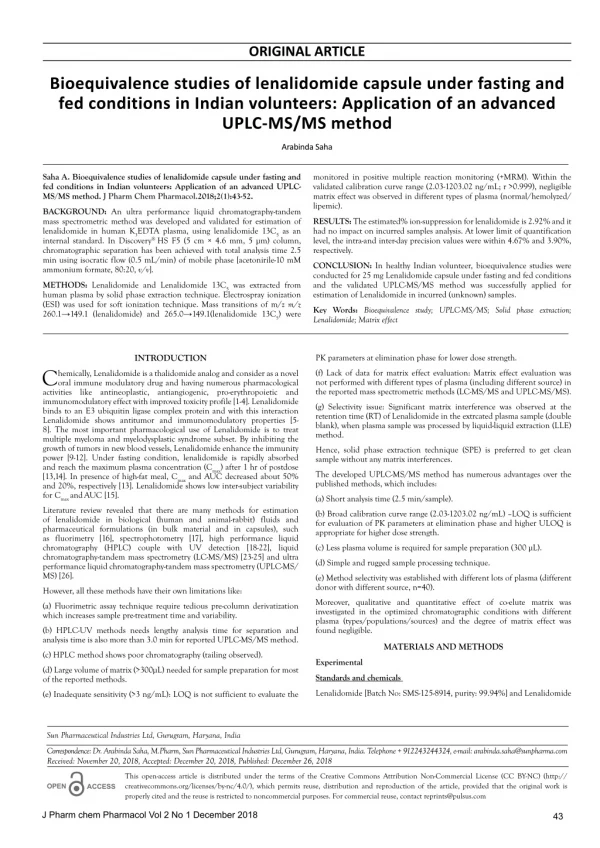
ORIGINAL ARTICLE Bioequivalence studies of lenalidomide capsule under fasting and fed conditions in Indian volunteers: Application of an advanced UPLC-MS/MS method Arabinda Saha Saha A. Bioequivalence studies of lenalidomide capsule under fasting and fed conditions in Indian volunteers: Application of an advanced UPLC- MS/MS method. J Pharm Chem Pharmacol.2018;2(1):43-52. monitored in positive multiple reaction monitoring (+MRM). Within the validated calibration curve range (2.03-1203.02 ng/mL; r >0.999), negligible matrix effect was observed in different types of plasma (normal/hemolyzed/ lipemic). BACKGROUND: An ultra performance liquid chromatography-tandem mass spectrometric method was developed and validated for estimation of lenalidomide in human K3EDTA plasma, using lenalidomide 13C5 as an internal standard. In Discovery® HS F5 (5 cm × 4.6 mm, 5 µm) column, chromatographic separation has been achieved with total analysis time 2.5 min using isocratic flow (0.5 mL/min) of mobile phase [acetonirile-10 mM ammonium formate, 80:20, v/v]. RESULTS: The estimated% ion-suppression for lenalidomide is 2.92% and it had no impact on incurred samples analysis. At lower limit of quantification level, the intra-and inter-day precision values were within 4.67% and 3.90%, respectively. CONCLUSION: In healthy Indian volunteer, bioequivalence studies were conducted for 25 mg Lenalidomide capsule under fasting and fed conditions and the validated UPLC-MS/MS method was successfully applied for estimation of Lenalidomide in incurred (unknown) samples. METHODS: Lenalidomide and Lenalidomide 13C5 was extracted from human plasma by solid phase extraction technique. Electrospray ionization (ESI) was used for soft ionization technique. Mass transitions of m/z m/z 260.1→149.1 (lenalidomide) and 265.0→149.1(lenalidomide 13C5) were Key Words: Bioequivalence study; UPLC-MS/MS; Solid phase extraction; Lenalidomide; Matrix effect INTRODUCTION PK parameters at elimination phase for lower dose strength. C activities like antineoplastic, antiangiogenic, pro-erythropoietic and immunomodulatory effect with improved toxicity profile [1-4]. Lenalidomide binds to an E3 ubiquitin ligase complex protein and with this interaction Lenalidomide shows antitumor and immunomodulatory properties [5- 8]. The most important pharmacological use of Lenalidomide is to treat multiple myeloma and myelodysplastic syndrome subset. By inhibiting the growth of tumors in new blood vessels, Lenalidomide enhance the immunity power [9-12]. Under fasting condition, lenalidomide is rapidly absorbed and reach the maximum plasma concentration (Cmax) after 1 hr of postdose [13,14]. In presence of high-fat meal, Cmax and AUC decreased about 50% and 20%, respectively [13]. Lenalidomide shows low inter-subject variability for Cmax andAUC [15]. Literature review revealed that there are many methods for estimation of lenalidomide in biological (human and animal-rabbit) fluids and pharmaceutical formulations (in bulk material and in capsules), such as fluorimetry [16], spectrophotometry [17], high performance liquid chromatography (HPLC) couple with UV detection [18-22], liquid chromatography-tandem mass spectrometry (LC-MS/MS) [23-25] and ultra performance liquid chromatography-tandem mass spectrometry (UPLC-MS/ MS) [26]. (f) Lack of data for matrix effect evaluation: Matrix effect evaluation was not performed with different types of plasma (including different source) in the reported mass spectrometric methods (LC-MS/MS and UPLC-MS/MS). hemically, Lenalidomide is a thalidomide analog and consider as a novel oral immune modulatory drug and having numerous pharmacological (g) Selectivity issue: Significant matrix interference was observed at the retention time (RT) of Lenalidomide in the extrcated plasma sample (double blank), when plasma sample was processed by liquid-liquid extraction (LLE) method. Hence, solid phase extraction technique (SPE) is preferred to get clean sample without any matrix interferences. The developed UPLC-MS/MS method has numerous advantages over the published methods, which includes: (a) Short analysis time (2.5 min/sample). (b) Broad calibration curve range (2.03-1203.02 ng/mL) –LOQ is sufficient for evaluation of PK parameters at elimination phase and higher ULOQ is appropriate for higher dose strength. (c) Less plasma volume is required for sample preparation (300 µL). (d) Simple and rugged sample processing technique. (e) Method selectivity was established with different lots of plasma (different donor with different source, n=40). However, all these methods have their own limitations like: Moreover, qualitative and quantitative effect of co-elute matrix was investigated in the optimized chromatographic conditions with different plasma (types/populations/sources) and the degree of matrix effect was found negligible. (a) Fluorimetric assay technique require tedious pre-column derivatization which increases sample pre-treatment time and variability. (b) HPLC-UV methods needs lengthy analysis time for separation and analysis time is also more than 3.0 min for reported UPLC-MS/MS method. MATERIALS AND METHODS (c) HPLC method shows poor chromatography (tailing observed). Experimental (d) Large volume of matrix (>300µL) needed for sample preparation for most of the reported methods. Standards and chemicals Lenalidomide [Batch No: SMS-125-8914, purity: 99.94%] and Lenalidomide (e) Inadequate sensitivity (>3 ng/mL): LOQ is not sufficient to evaluate the Sun Pharmaceutical Industries Ltd, Gurugram, Haryana, India Correspondence: Dr. Arabinda Saha, M.Pharm, Sun Pharmaceutical Industries Ltd, Gurugram, Haryana, India. Telephone + 912243244324, e-mail: arabinda.saha@sunpharma.com Received: November 20, 2018, Accepted: December 20, 2018, Published: December 26, 2018 This open-access article is distributed under the terms of the Creative Commons Attribution Non-Commercial License (CC BY-NC) (http:// creativecommons.org/licenses/by-nc/4.0/), which permits reuse, distribution and reproduction of the article, provided that the original work is properly cited and the reuse is restricted to noncommercial purposes. For commercial reuse, contact reprints@pulsus.com OPEN ACCESS J Pharm chem Pharmacol Vol 2 No 1 December 2018 43
Saha 13C5 (internal standard, IS, Batch No: VL/D-366, purity: 99.14%) were procured from Bioorganics, Mumbai, India and Vivan Life science, Bangalore, India respectively (chemical structures are shown in Figure 1). Ammonium formate (LCMS grade) and acetonitrile (LCMS grade) were procured from Fluka (Sigma-Aldrich, steinheim, USA). Dimethyl sulphoxide (DMSO) was obtained from Fischer Scientific, India. Milli-Q water (Millipore, Moscheim Cedex, France) was used in the preparation of solutions. From Agela Technologies (China), cleanert PEP (30 mg/1 mL) cartridges were procured. Human plasma lots (containing K3EDTA as anticoagulant) were obtained from Yash Laboratories, Delhi, India and Biological Specialty Corporation, PA. as an extracting solvent. Refrigerated centrifuge spun at 2000 rcf for 1 min for each step. The extracted samples were dried under nitrogen evaporator (Caliper, Hopkinton, MA, USA) at 50°C and then the dried samples were reconstituted with 400 µL of mobile phase. Method validation A complete method validation was performed as per the USFDA bioanalytical guideline 2001 [27] and EMEA bioanalytical guideline 2011 [28] for the developed UPLC-MS/MS method. Critical parameters like selectivity, sensitivity, linearity, precision, accuracy, recovery, matrix effect and stability (short term as well as long term) were evaluated during validation stage. UPLC-MS/MS instrumentation and optimized conditions Selectivity and S/N ratio Chromatographic separation has been achieved using Discovery® HS F5 analytical column (Dimension: 5 cm × 4.6 mm, 5 µm) with isocratic flow (0.5 mL/min) of mobile phase (acetonirile-10 mM ammonium format, 80:20, v/v). Column oven and autosampler (in injector) were maintained at 35°C ± 1°C and 10°C ± 1°C, respectively. For analysis, injection volume kept as 20µL. Between two successive injections (before and after aspiration), the injection needle was washed with rinsing solution (acetonitrile-water, 50:50, v/v). To assessed the selectivity of the method, ten lots of human plasma [6 normal plasma, 2 haemolyzed plasma (of level 6) and 2 lipemic plasma] were processed as per the extraction protocol and analyzedin UPLC-MS/ MS system. The interference at the RT of lenalidomide and IS in the double blank (without analyte and IS) should be less than 20% and 5% of mean peak area of lenalidomide and IS, respectively. Signal to noise ratio (S/N), which is a crucial parameter was calculated by the following formula and at LOQ level, S/N should be greater than 5. Triple quadruple mass spectrometer API-3200 (Sciex Division of MDS, Toronto, Ontario, Canada) was employed in positive polarity to detect the mass transitions (m/z) 260.1→149.1 and 265.0→149.1 for Lenalidomide and IS, respectively. The compound and source parameters were optimized by flow injection analysis (FIA) method. For this purpose, 20 µL of optimization dilution (containing lenalidomide and IS, ~100.0 ng/mL) were injected into the mass spectrometer without UPLC column and the peak area count of the target mass transitions (m/z) were monitored through (+) MRM in Analyst software (version 1.6.3). The optimized value of compound and source parameters are enlisted in Table 1. In triple quadrupole, unit resolution was maintained for both the quadrupoles (Quadrupole 1 and Quadrupole 3) and dwell time set as 400 millisec for all analytes. S N Signal to noise ratio of LOQ Mean signal to noise ratio of double bl = ank s Linearity, precision and accuracy Regression analysis was performed to established linearity and the calibration curves (n=3) which were the part of validation batches were involved for this calculation. In regression analysis, each calibration curve was analyzed by applying different weighting factor (1/Xand1/X2, where x=peak area ratio) and best fitted calibration curve (correlation coefficient, r>0.99) was obtained with weighting factor 1/X2. The intra-run (within a day, n=12) and inter-run (between days, n=18) accuracy and precision were determined by analyzing three validation batches in which replicate QC samples were processed. The calculated precision (coefficient of variation, % CV) should be <15.0 for all QC’s and for LOQQC, it should be <20.0. Similarly, for all level of QC’s, the mean% accuracy (or %bias) should be within ± 15.0% from their respective spiked concentrations and for LOQQC, it should be ± 20.0% of the spiked concentration. Spiking of samples Stock solutions of lenalidomide and IS were prepared in dimethyl sulphoxide (DMSO) at a concentration of 1000 µg/mL and 500 µg/mL, respectively. For preparation of QC samples, separate stock solution of lenalidomide was prepared. Working solutions of lenalidomide and IS were prepared using acetonitrile-water (50:50, v/v). Non-zero calibration standards (n=8) and QC samples were prepared by spiking (2%, v/v) of the working solutions of lenalidomide in drug free human K3EDTA plasma. Non-zero calibration standards were prepared at concentrations of 2.03, 5.46, 12.99, 43.31, 144.36, 481.21, 962.42 and 1203.02 ng/mL. QC samples were prepared at four levels i.e. 2.03 ng/mL (lower limit of quantification: LOQQC), 5.45 ng/mL (low quality control: LQC), 482.00 ng/mL (medium quality control: MQC) and 964.00 ng/mL (high quality control: HQC). The bulk-spiked samples (CS and QC’s) were stored in deep freezer (below-50°C). Matrix effect and recovery Post column infusion technique ‘T’-joint experiment (post-column infusion technique) is a qualitative method and often used in bio-analysis to verify the effect of co-elute matrix upon ionization of molecule in ion-source of mass spectrometer [29]. To conduct this experiment, a neat solution (containing lenalidomide and IS, ~100 ng/ mL each) was infused to mass spectrometer through infusion pump at a flow rate of 10 µL/min (via ‘T’ connector) and an extracted plasma sample was injected through UPLC column. In Analyst software (version 1.6.3), mass- chromatograms were monitored for m/z 260.1→149.1 (lenalidomide) and 265.0→149.1 (IS). In the mass chromatogram, TIC was found stable for both analytes and intensity is not affected in presence of biological sample and no suppression zone was observed at the RT of analyte(s). It undoubtedly indicate that, there is a null or negligible effect of co-elute matrix upon ionization of target molecule in ESI ion source [30]. Sample extraction technique Solid phase extraction was performed in refrigerated centrifuge (at 2000 rcf and 4°C) using cleanert PEP cartridge. In the labeled polypropylene tubes, 300 µL of plasma sample and 50 µL of IS working solution (150.0 ng/mL of IS) was added. Then, samples were pre-treated with 400 µL of Milli-Q water and to maintained the homogeneity, vortexed the samples for minimum 5 sec. Till pre-treatment step, plasma samples were kept in ice-cold water bath to prevent the hydrolytic cleavage of lenalidomide’s glutarimide ring. Cleanert PEP cartridges were equilibrated with 500 µL of acetonitrile followed by 500 µL of Milli-Q water and then pre-treated samples were loaded on to the cartridges. The cartridges were washed with 1 mL of Milli-Q water twice. The lenalidomide and IS were eluted from the cartridge using acetonitrile (1 mL) Absolute matrix effect It is essential to determine the degree (or quantitative evaluation) of matrix effect which have an impact on ionization of molecule in mass spectrometer, specially when ESI is used as a soft ionization technique. For evaluation of the absolute matrix effect (AME), post extraction addition technique was employed. In post extraction addition technique, co-elute matrix effect can be estimated quantitatively. Required number of aliquots of different plasma lots (including hemolyzed and lipemic plasma) were processed as per sample processing protocol (without addition of IS). The reference dilutions were prepared at 100% final extracted concentrations for Lenalidomide and IS at LQC, MQC and HQC level. To prepare the post extracted samples (PEX), the respective reference dilutions were added to the dried plasma samples and analyzed in UPLC-MS/MS system along with the neat samples (NS). The absolute matrix effect (AME) was estimated by the following formula: Mean peak area response of analyte in PEX Mean peak area response of analyte in NS = 1] 100 − × % AME [ A B Figure 1) Chemical structures of Lenalidomoide (1A) and Lenalidomoide-13C5 (1B) J Pharm chem Pharmacol Vol 2 No 1 December 2018 44
Bioequivalence studies of Lenalidomide capsule: Application of UPLC-MS/MS method The importance of AME value in bio-analysis: AME=1, it indicate null matrix effect; AME<1, it indicate ion-suppression, and AME>1, it indicate ion-enhancement. blood samples were kept in ice-cold water bath for required duration and these samples served as stability samples. After completion of the required storage duration, comparison samples were prepared in similar way and four aliquots each QC samples (stability and comparison samples) were processed and analyzed in UPLC-MS/MS system. The stability duration was calculated as the difference between the times of spiking of comparison samples less the time of spiking of stability samples. The % stability was determined with following equation: Mean peak area ratio of stability samples % Stability Mean peak area ratio of stability sample Method application Using the following equation, ISTD-normalized matrix effect (ISTD-ME) was determined at LQC and HQC level. Peak area ratio of PEX sample ISTD-ME [ Mean peak area ratio of NS samples = ] Recovery (or process efficiency) = − × 1 1 00 Both types of recovery (absolute and relative recovery) were evaluated for the proposed extraction technique. Three types of QC sample were processed and analyzed in an analytical sequence (i.e. extracted sample→post-extracted samples→neat samples). Six aliquots of extracted samples and post-extracted samples (18 aliquots of dounle blank) were processed for each QC level (LQC, MQC and HQC level) and six replicate injections of neat sample were given from the same vial. The absolute recovery (ARE) was estimated by comparing the peak area response of analyte in extracted sample (EX) and neat sample (NS). For relative recovery (RRE), peak area response of EX sample was compared with post-extracted (PEX) samples. In PEX and NS sample, the concentrations of Lenalidomide and IS are equivalent to those obtained in the respective extracted QC samples. s For evaluation of PK parameters of Lenalidomide between two pharmaceutical formulations (25 mg capsule of sun pharmaceutical industries limited, India and Revlimid®capsule 25 mg of Celgene Corporation, Summit, NJ07901, USA), open label, balanced, randomized, two-treatment, two-period, two- sequence, single-dose, crossover bioequivalence studies were conducted under fasting and fed conditions. Study protocols were approved by Ethics Committee of Institutional Review Board at Jamia Hamdard Institutional Review Board, New Delhi, India. The total number of volunteers those who have completed both the periods are 24 and 31 for fasting and fed study, respectively. A single oral dose of Lenalidomide 25 mg capsule, blood samples were collected before (pre-dose) and at 0.167, 0.333, 0.500, 0.667, 0.833, 1.000, 1.167, 1.333, 1.500, 1.750, 2.000, 2.333, 2.667, 3.000, 3.500, 4.000, 5.000, 7.000, 10.000, 12.000, 16.000, 20.000 and 24.000 hr post dose for fasting study. Simillarly, blood samples were collected before (pre- dose) and at 0.250, 0.500, 0.750, 1.000, 1.333, 1.667, 2.000, 2.333, 2.667, 3.000, 3.333, 3.667, 4.000, 4.500, 5.000, 6.000, 8.000, 10.000, 12.000, 16.000, 20.000 and 24.000 hr post dose for fed study. Plasma samples were seperated from the whole blood samples by centrifugation technique and after separation, plasma samples were stored below-50°C until analysis. Absolute recovery (ARE) and Relative recovery (RRE) was calculated by the following equations: Mean peak area response of Lenalidomide in EX samples Mean peak area response of Lenalidomide in NS samples = × % ARE 100 Mean peak area response of Lenalidomide in EX samples Mean peak area response of Lenalidomide in PEX samples = 100 × % RRE Relative matrix effect Quality control samples were prepared in ten lotsof human plasma (including two hemolyzed plasma and two lipemic plasma) and used to evaluate the absence or presence of a relative matrix effect (RME) in the proposed method. For this purpose, working solutions of Lenalidomide (at LOQQC and HQC level) were spiked in the screened plasma lots. Matrix effect quality control (MEQC) samples were processed in duplicate for each lot and analyzed in the optimized chromatographic conditions. The back-calculated concentration of MEQC samples were used to confirm the acceptability of the result. At LOQQC level, % accuracy of MEQC samples should be within ± 20% and for HQC level % accuracy of MEQC samples should be within ± 15% of their respective nominal value. Individual mean % accuracy and % CV was calculated for MEQC samples (spiked in each plasma) to check the variability and reproducibility of the method. Incurred sample reanalysis In current scenario, incurred sample reanalysis (ISR) is a most important tool in bio-analysis. In numerous submissions, discrepancies are observed between original and repeat analysis data. Hence, USFDA guideline declared that ISR have to perform in multiple occasions during the course of bio- analysis. The probable reasons that causes of irreproducibility in ISR run or ISR run failure can be caused by the following reasons (but not limited to): a. Contamination of incurred samples after initial (or original) analysis. Stability exercises b. Drug instability issue (labile metabolite): Suitable conditions may not follow for storing of incurred samples that may leads to back conversion of the labile metabolite(s) to its parent moiety. At storage condition (1-10°C), stock solution stability of analyte was performed by comparing the peak area between the stability stock solution and fresh stock solution. Under various handling condition, Lenalidomide stability in human plasma were established by analyzing four replicates QC samples (stability and comparison samples, at LQC and HQC level) along with freshly prepared calibration standards. As per regulatory guidelines, the % change should be less than 15 and was determined by the following formula: [s % C 1] 100 F Where, S=Mean calculated concentration of stability samples and F=Mean calculated concentration of freshly spiked samples. c. Drug-protein binding differences in volunteers. d. Concomitant medication: That are given to the volunteer during the clinical phase and may be the probable cause for interference. e. Matrix effect (or phospholipids) related issue: If co-elute matrix have an impact on ionization of the target analytes leads to inconsistent recovery that may affect on expected concentration of drug. hange = − × f. Sample in-homogeneity: Incase of drug having solubility related issue, mixing (or vortexing) shall be done properly otherwise, incurred sample concentration may vary due to in-homogenous nature of the sample. Bench top stability (BTS) in matrix was established by storing the stability QC samples for required duration in ice-cold water bath prior to processing. In auto-sampler stability (in-injector stability, ASS), extracted stability QC samples were maintained at 10°C before being analyzed. To established the freeze-thaw stability (FTS), stability samples that had been frozen in deep freezer (below -50°C) and thawed in ice-cold water bath for three times and then processed and analyzed with freshly spiked CC and comparison QC samples. For long term stability (LTS) evaluation, the concentrations of the spiked QC samples was determined after required storage duration (in days) and compared with the original (or spiked) concentrations. During selection of the incurred samples for ISR run, below mentioned criteria was followed: a. At absorption phase (at Cmax level). b. At elimination phase (where, incurred sample concentration >3 × LOQ). For fasting study, 162 incurred samples and for fed study 173 incurred samples was selected and analyzed for ISR evaluation. The % difference should be within ± 20% for 67% of total selected ISR samples and was calculated by the following equation. To demonstrate the stability of Lenalidomide in blood, human whole blood (K3EDTA, as anticoagulant) was incubated at 37°C for 15 min to mimic the condition with incurred samples. After incubation, the working solutions of Lenalidomide (at LQC and HQC level) were spiked in blood and the spiked J Pharm chem Pharmacol Vol 2 No 1 December 2018 45
Saha Figure 2) Parent ion and product ion spectra of Lenalidomide and Lenalidomide-13C5 J Pharm chem Pharmacol Vol 2 No 1 December 2018 46
Bioequivalence studies of Lenalidomide capsule: Application of UPLC-MS/MS method 1.139 A D 1.139 36 3.0e4 2.9e4 34 2.8e4 2.7e4 32 2.6e4 0.768 30 2.5e4 2.4e4 28 2.3e4 2.2e4 26 2.1e4 0.287 1.687 2.0e4 0.586 24 0.053 1.9e4 1.8e4 22 1.7e4 0.432 20 0.950 1.6e4 Intensity, cps Intensity, cps 1.5e4 1.586 18 1.4e4 1.3e4 16 1.2e4 2.024 2.152 1.1e4 14 1.0e4 12 9000.0 8000.0 10 7000.0 6000.0 8 5000.0 4000.0 6 3000.0 4 2000.0 1000.0 2 0.0 0.0 0.1 0.2 0.3 0.4 0.5 0.6 0.7 0.8 0.9 1.0 1.1 1.2 Time, min 1.3 1.4 1.5 1.6 1.7 1.8 1.9 2.0 2.1 2.2 2.3 2.4 0 0.0 0.1 0.2 0.3 0.4 0.5 0.6 0.7 0.8 0.9 1.0 1.1 1.2 Time, min 1.3 1.4 1.5 1.6 1.7 1.8 1.9 2.0 2.1 2.2 2.3 2.4 0.768 1.146 2800 460 E B 2700 440 2600 420 2500 400 2400 2300 380 2200 360 2100 340 2000 320 1900 1800 300 2.011 1700 280 1600 260 Intensity, cps 1500 Intensity, cps 240 1400 1300 220 1200 200 1100 180 1.077 1000 160 900 800 140 700 120 600 1.752 100 1.469 500 400 80 0.419 300 60 200 40 100 20 0 0.0 0.1 0.2 0.3 0.4 0.5 0.6 0.7 0.8 0.9 1.0 1.1 1.2 Time, min 1.3 1.4 1.5 1.6 1.7 1.8 1.9 2.0 2.1 2.2 2.3 2.4 0 0.0 0.1 0.2 0.3 0.4 0.5 0.6 0.7 0.8 0.9 1.0 1.1 1.2 Time, min 1.3 1.4 1.5 1.6 1.7 1.8 1.9 2.0 2.1 2.2 2.3 2.4 1.140 F 0.784 3.4e4 1.172 3.3e4 40 3.2e4 3.1e4 38 3.0e4 2.9e4 36 C 2.8e4 34 2.7e4 2.6e4 32 2.5e4 2.4e4 30 2.3e4 0.040 28 2.2e4 0.571 0.646 2.1e4 26 0.198 2.0e4 2.102 0.980 1.9e4 24 Intensity, cps 0.432 1.8e4 1.7e4 Intensity, cps 22 1.621 1.6e4 20 1.5e4 1.4e4 18 1.3e4 1.2e4 16 1.1e4 14 1.0e4 9000.0 12 8000.0 7000.0 10 6000.0 5000.0 8 4000.0 6 3000.0 2000.0 4 1000.0 0.0 2 0.0 0.1 0.2 0.3 0.4 0.5 0.6 0.7 0.8 0.9 1.0 1.1 1.2 Time, min 1.3 1.4 1.5 1.6 1.7 1.8 1.9 2.0 2.1 2.2 2.3 2.4 0 0.0 0.1 0.2 0.3 0.4 0.5 0.6 0.7 0.8 0.9 1.0 1.1 1.2 Time, min 1.3 1.4 1.5 1.6 1.7 1.8 1.9 2.0 2.1 2.2 2.3 2.4 1.147 G 1.139 H 1.05e6 2.9e4 2.8e4 1.00e6 2.7e4 9.50e5 2.6e4 2.5e4 9.00e5 2.4e4 8.50e5 2.3e4 2.2e4 8.00e5 2.1e4 7.50e5 2.0e4 7.00e5 1.9e4 1.8e4 6.50e5 1.7e4 6.00e5 1.6e4 Intensity, cps Intensity, cps 1.5e4 5.50e5 1.4e4 5.00e5 1.3e4 4.50e5 1.2e4 1.1e4 4.00e5 1.0e4 3.50e5 9000.0 8000.0 3.00e5 7000.0 2.50e5 6000.0 5000.0 2.00e5 4000.0 1.50e5 3000.0 1.00e5 2000.0 1000.0 5.00e4 0.0 0.0 0.1 0.2 0.3 0.4 0.5 0.6 0.7 0.8 0.9 1.0 1.1 1.2 1.3 1.4 1.5 1.6 1.7 1.8 1.9 2.0 2.1 2.2 2.3 2.4 0.00 0.0 0.1 0.2 0.3 0.4 0.5 0.6 0.7 0.8 0.9 1.0 1.1 1.2 Time, min 1.3 1.4 1.5 1.6 1.7 1.8 1.9 2.0 2.1 2.2 2.3 2.4 A) Double blank (260.1→149.1: Lenalidomide), B) Double blank (265.0→149.1: Lenalidomide-13C5), C) Single blank (260.1→149.1: Lenalidomide), D) Single blank (265.0→149.1: Lenalidomide-13C5, E) Spiked LOQ (260.1→149.1: Lenalidomide), F) Spiked LOQ (265.0→149.1: Lenalidomide-13C5), G) Spiked ULOQ (260.1→149.1: Lenalidomide), H) Spiked ULOQ (265.0→149.1: Lenalidomide-13C5) Figure 3) Representative chromatograms: (A) Double blank sample, (B) single blank sample, (C) LOQ sample and (D-H) ULOQ sample at the RT of Lenalidomide and IS J Pharm chem Pharmacol Vol 2 No 1 December 2018 47
Saha A A B B Figure 4) Plasma profile of Lenalidomide under fasting condition (N=24) R: Reference drug; T: Test drug; (4A) Linear plot of mean plasma concentration (ng/ mL) vs. time (hr) and (4B) Semi log plot of mean plasma concentration (ng/mL) vs. time (hr) Figure 5) Plasma profile of Lenalidomide under fed condition (N=31) R: Reference drug; T: Test drug; (5A) Linear plot of mean plasma concentration (ng/mL) vs. time (hr) and (5B) Semi log plot of mean plasma concentration (ng/mL) vs. time (hr) TABLE 1 Optimized mass spectrometric parameters Unit m/z: m/z: Parameters type Name of the parameters 260.1→149.1 (Lenalidomide) 36 V 10 V 23 V 3 V 265.0→149.1 (Lenalidomide 13C5) 36 V 10 V 23 V 3 V Declustering potential (DP) Entrance potential (EP) Collision energy (CE) Collision cell exit potential (CXP) Collision activated dissociation gas (CAD) Curtain gas (CUR) Nebulizer gas (GS1) Heater gas (GS2) Turbo ion spray voltage Source temperature Compound parameters 5 psi 15 psi 65 psi 40 psi 5500 V 450°C Source parameters was used in positive polarity. Initially, to decrease the % ion-suppression, atmospheric pressure chemical ionization (APCI) was also evaluated as an ion-source. ESI was chosen as an ionization technique over APCI, because of its improved S/N (>250) for extracted samples. During product ion scan, four major product ions of m/z 140.9, 158.0, 162.9, 149.1 was observed in the MS-MS spectra of Lenalidomide. Stable and most intense product ion of m/z 149.1 was selected for Lenalidomide (Figure 2) and it was also noted that compound parameters like, CE, CXP and CAD are critical to achieve highest sensitivity and stable response for Lenalidomide. During method tuning it Reanalyzed concentration – Original concentration Mean of Reanalyzed and original concentration = 100 × % Difference RESULTS AND DISCUSSION Optimization of mass parameters Lenalidomide [IUPAC name: 3-(4-Amino-1-oxoisoindolin-2-yl) piperidine- 2,6-dione] contain piperidine nucleus, hence electrospray ionization (ESI) J Pharm chem Pharmacol Vol 2 No 1 December 2018 48
Bioequivalence studies of Lenalidomide capsule: Application of UPLC-MS/MS method TABLE 2 Intra-and inter-run results Intra-run (n =12) Inter-run(n=18) Added Mean observed concentration (ng/ mL) 2.06 5.90 474.82 877.82 Mean observed concentration (ng/ mL) 2.02 5.75 476.04 887.22 QC sample concentration (ng/ mL) % Relative error or bias % Relative error or bias %CV %CV LOQQC LQC MQC HQC 2.03 5.45 482.00 964.00 1.48 8.26 -1.49 -8.94 4.67 1.99 1.39 1.41 -0.49 5.50 -1.24 -7.96 3.90 4.06 1.70 1.97 TABLE 3 Absolute matrix effect and process efficiency of lenalidomide QC level LQC MQC HQC Post extracted sample (PEX) 5998948 6139625 6521548 6288582 6184356 6286729 6236631 2.82 Post extracted sample (PEX) Post extracted sample (PEX) Neat sample (NS) Extracted sample (EX) Neat sample (NS) Extracted sample (EX) Neat sample (NS) Extracted sample (EX) Serial No. 1 2 3 4 5 6 37080 38136 36878 34132 36502 35847 36429 3.72 42035 42980 44278 43394 43402 44262 43392 1.94 46396 45532 44254 42757 43541 43893 44396 3.02 2790777 2697603 2714083 2680058 2691710 2730539 2717462 1.47 3518623 3470446 3510297 3430226 3464450 3471519 3477593 0.93 3665532 3582087 3508760 3581335 3600937 3600697 3589891 1.40 5614289 4926387 5007528 4919084 5179692 4801245 5074704 5.76 6555630 6634343 6484224 6390530 6358312 6297807 6453474 1.98 Mean %CV Mean peak area ( with C.F) Linalidomide concentration (ng/mL) % Absolute Recovery % Relative Recovery % ion-suppression Correction factor (C.F) for absolute recovery=concentration of analyte in EX sample/concentration of analyte in NS sample Correction factor (C.F) for relative recovery=concentration of analyte in EX sample/concentration of analyte in PEX sample 43902 44917 3475478 3587708 6232838 6449549 4.09 4.04 4.04 361.50 361.72 361.72 723.00 723.44 723.44 81.10 82.98 2.26 75.74 78.19 3.13 78.68 81.42 3.36 was prominently observed that when Lenalidomide was analyzed alone with CXP value 10 or more in (+)MRM, causes significant interference in m/z of Lenalidomide 13C5 (IS). After re-optimization of mass parameters, CXP value set as 3 for Lenalidomide and for confirmatory purpose Lenalidomide neat dilution was again analyzed alone with (+) MRM of CXP value was 3 and no interference was observed in m/z of Lenalidomide 13C5 (IS). Optimization of chromatographic conditions cartridges. At basic condition (pH>7.0) and acidic condition (pH<7.0), poor recovery is observed for both analyte and IS. At higher and lower pH, % unionized form of Lenalidomide and IS is more and not suitable to retain in SPE cartridge after loading of pre-treated sample and shows poor recovery. In addition, washed the SPE with 1 mL of water twice helped to eliminate the matrix components. Method validation Selectivity and S/N ratio Chromatographic optimization of Lenalidomide and IS was carried out under isocratic condition to achieved short analysis time with adequate response, sharp and symmetrical peak shape of target analytes. Chromatographic conditions optimized in reversed phase UPLC columns [viz., Acquity UPLC BEH C18 (100 × 2.1 mm, 1.7 µ), Gemini NX C18 (50 × 3 mm, 3 µ) and Discovery C8 (50 × 4.6 mm, 5 µ) and Discovery® HS F5 (5 cm × 4.6 mm, 5 µm)] using different mobile phase compositions where a range of ratio of methanol-acetonitrile (with or without addition of volatile buffers and additives) were used. Lenalidomide showed nonlinear behavior in most of the UPLC columns (i.e. correlation coefficient, r<0.99), whereas in Discovery® HS F5 (5 cm × 4.6 mm, 5 µm) column linearity was achieved with S/N grater than 200. During method optimization, selectivity data was not meet the acceptance criteria, as an endogenous peak was eluted at the RT of IS (1.1 min) and causes of significant interference (>5% of mean peak area response of IS) in the extracted plasma sample (double blank). To separate this endogenous peak, chromatographic condition was again re- optimized. After changing the mobile phase composition (acetonirile-10 mM ammonium formate buffer, 80:20, v/v), the endogenous peak was separeated from the peak of interest and eluted at 0.7 min (RT of IS 1.1 min). No significant interference was observed at the RT of Lenalidomide and IS in the extracted double blank and maximum interference was 2.15% and 0.59% for Lenalidomide and IS, respectively. The representative chromatograms of double blank sample, single-blank sample (processed with IS), LOQ and ULOQ samples are shown in Figure 3. We observed that S/N ratio was > 250 throughout the method validation and bio-analysis. Linearity, precision and accuracy All three calibration curves were linear over the calibration range of 2.03 to 1203.02 ng/mL. A straight-line fit was made through the data points by least square analysis and constant proportionality was observed. At LOQQQC level, the precision and % bias were 4.67% and 1.48%, respectively. The results of three precision and accuracy batches are summarized in Table 2. The intra-day precision and inter-day precision (%CV) ranged from 1.39 to 4.67 and the intra-day and inter-day relative error (% bias) ranged from -8.94 to 8.26. Matrix effect and recovery Between neat solution and post-extracted samples, no significant difference in peak area response was observed for Lenalidomide and IS and it indicate negligible matrix effect (Table 3). The % ion-suppression was varies from 2.26 to 3.36 across the QC levels. The mean absolute recovery (ARE) and relative recovery (RRE) of Lenalidomide was 78.51% and 80.86% (%CV<4). The ARE and RRE value of IS was 81.47% and 84.06%, respectively. The results of relative matrix effect (RME) and ISTD-normalized matrix factor are summarized in Table 4. Sample preparation Due to hydrophobic nature of Lenalidomide, different polymeric SPE cartridges (i.e. Oasis HLB, Bond Elut Plexa, Cleanert PEP-H, Cleanert PEP-3 and Cleanert PEP) were evaluated for extraction efficiency during method development. % Recovery (process efficiency) is relatively high when plasma sample extracted with Cleanert PEP cartridge as compared to other SPE J Pharm chem Pharmacol Vol 2 No 1 December 2018 49
Saha TABLE 4 Relative matrix effect of lenalidomide Relative matrix effect LOQQC HQC AME (ISTD- normalized matrix effect, ISTD-ME d) Plasma lot Mean calculated concentration (ng/ mL) Mean calculated concentration (ng/ mL) %CV % biasc %CV % biasc LOT-1 2.00 0.71 -1.48 929.23 4.09 -3.61 1.01 LOT-2 1.99 5.34 -1.97 916.10 2.19 -4.97 1.00 LOT-3 2.06 1.03 1.48 921.28 1.31 -4.43 0.99 LOT-4 2.06 0.34 1.48 928.50 1.57 -3.68 1.01 LOT-5 2.03 3.84 0.00 939.68 0.59 -2.52 1.00 LOT-6 2.07 3.42 1.97 928.83 0.29 -3.65 1.01 2.15 8.24 5.91 931.03 4.84 -3.42 1.01 LOT-7a LOT-8a 2.01 0.00 -0.99 937.34 0.02 -2.77 1.01 LOT-9b 2.06 0.69 1.48 933.81 1.22 -3.13 1.01 2.01 3.88 -0.99 910.46 4.23 -5.55 1.00 LOT-10b Spiked concentration (ng/mL) of lenalidomide at LOQQC level is 2.03 and HQC level is 964.00 a hemolyzed plasma (level 6); b lipemic plasma c Bias=(observed concentration-spiked concentration)/spiked concentration ×100 d Overall Mean IS-normalized matrix effect at LQC, MQC and HQC levels TABLE 5 Stability of lenalidomide in different storage conditions (n=4) Comparison sample Stability sample Calculated concentration (ng/ mL) 5.60 931.15 5.44 Stability parameter Level Calculated %CV %CV % Change concentration (ng/mL) Auto sampler stability (~120.85 hr, 10ºC) Bench top stability (~6.58 hr, in ice-cold water bath) Freeze-thaw stability (Three freeze-thaw cycle) Long term stability (90 days, below -50ºC) LQC HQC LQC 5.42 954.40 5.42 2.6 0.7 2.6 2.5 1.6 1.1 3.4 -2.4 0.5 HQC 954.40 0.7 947.43 0.6 -0.7 LQC HQC LQC HQC 5.42 954.40 5.88 943.51 2.6 0.7 5.7 7.4 5.45 923.24 6.00 998.80 2.9 0.7 3.8 2.5 0.6 -3.3 2.1 5.9 TABLE 6 Pharmacokinetic parameters of lenalidomide Fasting condition (N=24) (Mean ± SD) Fed condition (N=31) (Mean ± SD) Pharmacokinetic Parameters Reference product 0.8133 ± 0.28291 Test product 0.7014 ± 0.23545 Reference product 2.7151 ± 0.79491 Test product 2.7096 ± 1.00189 Tmax (hr) Cmax (ng/mL) AUC 0→t (hr.ng/mL) AUC 0→∞ (hr.ng/mL) 555.960 ± 121.3538 615.178 ± 123.0255 248.908 ± 54.2806 248.814 ± 56.3186 1851.9313± 318.61666 1844.2689 ± 339.85264 1345.9140± 229.73144 1308.1224 ± 240.92591 1866.6301 ± 321.20047 1859.9414 ± 342.17884 1369.9653 ± 230.32634 1330.5539 ± 242.71473 concentration of comparison QC samples are remain same as shown in Table 5. Lenalidomide was stable in human K3EDTA whole blood for ~2.0 hr in ice-cold water bath. Stability exercises Stock solution stability of Lenalidomide and IS were established for 16 days at refrigerated temperature (1-10°C) and % stability of Lenalidomide and IS were 99.51 and 100.21, respectively. Bench top stability (BTS) data shows that, Lenalidomide was stable for ~6.5 hr in ice-cold water bath. ASS was estimated for ~120.8 hr, at sample storage condition (at 10°C) and LTS was found acceptable for a period of 90 days. For all stability excercises, the mean calculated concentration of Lenalidomide in stability samples was found to be within ± 15% of their respective nominal concentration and %CV was less than 15 at LQC and HQC level (Table 5). Stability experiments like, BTS, FTS and ASS were performed together, hence the calculated Method application Using WinNonlin Professional software (Version 5.0), the PK parameters like peak plasma concentration (Cmax), time to reach Cmax (Tmax), t1/2, AUC0→t and AUC0→∞ were calculated by including the 24 and 31 volunteers, who completed all periods of the study. The PK parameters of both the formulations are presented in Table 6. In presence of food, Cmax decreased about 58% and time to reach maximum concentration (Tmax) is delayed to 2.7 min from 0.7 min. The linear plot of mean plasma concentration (ng/ J Pharm chem Pharmacol Vol 2 No 1 December 2018 50
Bioequivalence studies of Lenalidomide capsule: Application of UPLC-MS/MS method TABLE 7 ISR representative data Period Original concentration (ng/mL) Re-analyzed concentration (ng/mL) % Difference Study type Volunteer No. Time point (hr) 9 11 12 17 19 21 24 26 15 22 1 3 6 9 11 17 20 23 30 38 I I I I II II I I I I I I II II I I II II II II 0.667 1.333 20.000 16.000 0.500 0.667 0.667 20.000 12.000 2.667 2.333 4.500 4.000 3.667 2.000 20.000 2.000 16.000 1.333 3.667 839.74 379.19 10.46 6.10 702.23 692.22 670.62 7.39 12.64 256.93 262.56 167.21 252.02 254.86 277.94 6.31 200.94 5.81 322.90 312.72 846.48 388.38 9.96 6.16 684.81 672.72 636.88 7.04 12.24 241.04 248.60 168.34 250.10 231.12 282.61 6.48 204.68 5.61 289.02 273.04 0.80 2.39 -4.90 0.98 -2.51 -2.86 -5.16 -4.85 -3.22 -6.38 -5.46 0.67 -0.76 -9.77 1.67 2.66 1.84 -3.50 -11.07 -13.55 Fasting study Fed study mL) vs. time (hr) and semi-log plot of mean plasma concentration (ng/mL) vs. time (hr) are presented in Figures 4 and 5, respectively. ISR results (Table 7) confirmed that incurred sample re-analysis run are accepted and 90.74% and 98.21% of the selected ISR samples are within the acceptance criteria for fasting and fed study, respectively. 3. Zhu YX, Kortuem KM, Stewart AK. Molecular mechanism of action of immune-modulatory drugs thalidomide, lenalidomide and pomalidomide in multiple myeloma. Leuk Lymphoma. 2013; 54:683–7. 4. Mitsiades CS, Mitsiades N. CC-5013 Celgene. Curr Opin Investig Drugs. 2004;5:635-47. CONCLUSION 5. Zhu YX, Braggio E, Shi CX, et al. Cereblon expression is required for the antimyeloma activity of lenalidomide and pomalidomide Blood. 2011;118:4771–79. In summary, a rapid, selective, specific, reproducible and high-throughput UPLC-MS/MS method was developed and validated to estimate Lenalidomide in human plasma. The method has been extensively validated as per the requirement of global regulatory agencies (like USFDA, EMA and ANVISA) and successfully applied for bioequivalence studies of Lenalidomide under fasting as well as fed condition. Selectivity and matrix effect was investigated and established in normal plasma, haemolysed plasma (>level 6, where, hemoglobin concentration is approximately 1000 mg/dL) and lipemic plasma and stability assessment of Lenalidomide in human K3EDTA whole blood are the unique features of the method. Incurred sample analysis was completed without any failures of analytical run/batch and confirmed the ruggedness as well as robustness of the validated method. Furthermore, the immense ISR data added further strength to our current method. All these advantages would make the validated method for routine analysis of large number (over 450 samples/day) of plasma samples within the shorter analysis time of 2.5 min. 6. Lopez-Girona A, Mendy D, Ito T, et al. Cereblon is a direct protein target for immunomodulatory and antiproliferative activities of lenalidomide and pomalidomide. Leukemia. 2012;26:2326–35. 7. Gandhi AK, Kang J, Havens CG, et al. Immunomodulatory agents lenalidomide and pomalidomide co-stimulate T cells by inducing degradation of T cell repressors Ikaros and Aiolos via modulation of the E3 ubiquitin ligase complex CRL4 (CRBN). Br J Haematol. 2014;164:811–21. 8. Guirguis AA, Ebert BL. Lenalidomide: Deciphering mechanisms of action in myeloma, myelodysplastic syndrome and beyond. Curr Opin Cell Biol. 2015; 37:61–7. 9. Rajkumar SV, Hayman SR, Lacy MQ, et al. Combination therapy with lenalidomide plus dexamethasone (Rev/Dex) for newly diagnosed myeloma. Blood. 2005;106:4050-53. COMPETING INTERESTS 10. Richardson PG, Blood E, Mitsiades CS, et al. A randomized phase 2 study of lenalidomide therapy for patients with relapsed or relapsed and refractory multiple myeloma. Blood. 2006;108:3458-64. The authors declare that they have no competing interests. 11. List A, Dewald G, Bennett J, et al. Lenalidomide in the myelodysplastic syndrome with chromosome 5q deletion N Engl J Med. 2006;355:1456-65. ACKNOWLEDGEMENTS 12. List A, Kurtin S, Roe DJ, et al. Efficacy of lenalidomide in myelodysplastic syndromes. N Engl J Med. 2005;352:549-57. All the authors wish to acknowledge the support and facilities received from Sun Pharmaceutical Industries Limited, Gurgaon, India, for carrying out this work. 13. Chen N, Kasserra C, Reyes J, et al. Single-dose pharmacokinetics of lenalidomide in healthy volunteers: dose proportionality, food effect, and racial sensitivity. Cancer Chemother Pharmacol. 2012;70:717–25. REFERENCES 14. Chen N, Wen L, Lau H, et al. Pharmacokinetics, metabolism and excretion of [(14)C]-lenalidomide following oral administration in healthy male subjects. Cancer Chemother Pharmacol. 2012;69:789–97. 1. Heise C, Carter T, Schafer P, et al. Pleiotropic mechanisms of action of lenalidomide efficacy in del (5q) myelodysplastic syndromes. Expert Rev Anticancer Ther. 2010;10:1663–72. 15. Chen N, Ye Y, Liu L, et al. Lenalidomide at therapeutic and supra therapeutic doses does not prolong QTc intervals in the thorough QTc study conducted in healthy men. Basic Clin Pharmacol Toxicol. 2013;113:179–86. 2. Zeldis JB, Knight R, Hussein M, et al. A review of the history, properties, and use of the immunomodulatory compound lenalidomide. Ann NY Acad Sci. 2011;1222:76–82. J Pharm chem Pharmacol Vol 2 No 1 December 2018 51
Saha 16. Darwish IA, Khalil NY, Bakheit AH, et al. A highly sensitive fluorimetric method for determination of lenalidomide in its bulk form and capsules via derivatization with fluorescamine. Chem Cent J. 2012;6:118. mass spectrometry. J Chromatogr B Analyt Technol Biomed Life Sci. 2004;811:135–41. 24. Liu Q, Farley KL, Johnson AJ, et al. Development and validation of a highly sensitive liquid chromatography/mass spectrometry method for simultaneous quantification of lenalidomide and flavopiridol in human plasma. Ther Drug Monit. 2008;5:620–27. 17. Sastry BS, Gananadhamu S, Prasad SVS, et al. New spectrophotometric methods for estimation of formulations. Int J Pharm Tech Res. 2009;1:416-19. lenalidomide in pharmaceutical 25. Ranganathanab P, Gunasekaran V, Singhvi I, et al. Development and validation of lenalidomide in human plasma by LC-MS/MS. Saudi J Biol Sci. 2018. 18. Saravanan G, Rao BM, Ravikumar M, et al. Development of an HPLC assay method for lenalidomide. Chromatographia. 2007;66:287–90. 19. Maheswara RL, Janardhan RK, Bhaskar RL, et al. Development of a rapid and sensitive HPLC assay method for lenalidomide capsules and its related substances. E-J Chem. 2012;9:1165–74. 26. Iqbal M, Wani TA, Khalil NY, et al. Development and validation of ultra-performance liquid chromatographic method with tandem mass spectrometry for determination of lenalidomide in rabbit and human plasma. Chem Cent J. 2013;7:7. 20. Alzoman NZ. A validated stability-indicating and stereoselective HPLC method for the determination of lenalidomide enantiomers in bulk form and capsules. J Chrom Sci. 2016;54:730-35. 27. Iqbal M. Guideline on bioanalytical method validation. European Medical Agency. 2011. 28. Ken A. Guidance for industry: Bioanalytical method validation. US Food and Drug Administration. 2001. 21. Pulla RP, Sastry BS, Prasad YR, et al. Estimation of lenalidomide in capsules dosage forms by RP-HPLC. J Pharm Res. 2011;4:1199-200. 29. Gurule S, Goswami D, Saha A, et al. Bioanalytical method development and validation using incurred samples-Quantitative estimation of metformin in human K3EDTA plasma by LC–MS/MS. Clin Res Regul Aff. 2012;29:23-34. 22. López BG, Pitarch AP, Gómez MAM, et al. A wide linearity range method for the determination of lenalidomide in plasma by high-performance liquid chromatography: Application to pharmacokinetic studies. J Lab Autom. 2016;21:806-10. 30. Viswanathan CT, Bansal S, Booth B, et al. Workshop/conference report: Quantitative bioanalytical methods validation and implementation: Best practices for chromatographic and ligand binding assays. AAPS J. 2007;9(1):30–42. 23. Tohnya TM, Hwang K, Lepper ER, et al. Determination of CC-5013, an analogue of thalidomide, in human plasma by liquid chromatography J Pharm chem Pharmacol Vol 2 No 1 December 2018 52