Download
1 / 46
460 likes | 466 Vues
This study analyzes incident dialysis patients from 1995 to 1999 and their cardiovascular events, including cardiac death and comorbidities such as diabetes and congestive heart failure. Geographic variations in comorbid conditions are also examined.

E N D
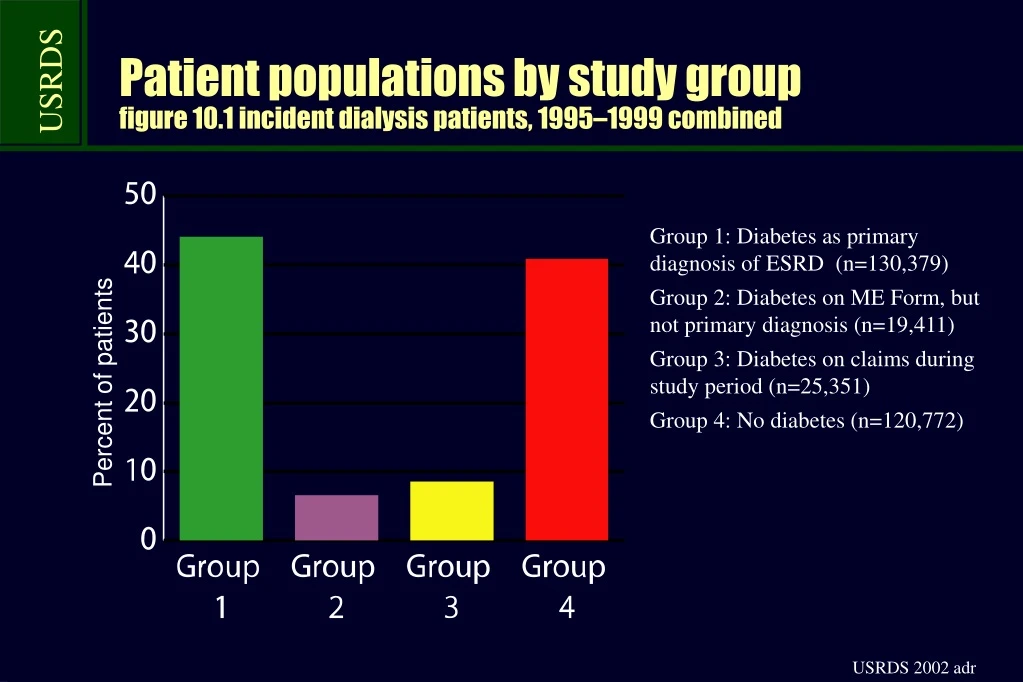
Patient populations by study groupfigure 10.1 incident dialysis patients, 1995–1999 combined Group 1: Diabetes as primary diagnosis of ESRD (n=130,379) Group 2: Diabetes on ME Form, but not primary diagnosis (n=19,411) Group 3: Diabetes on claims during study period (n=25,351) Group 4: No diabetes (n=120,772) Percent of patients
Cardiac death ratesfigure 10.2 per 1,000 patient years, incident dialysis patients, 1995–1999 combined, by HSA, unadjusted Percent of patients 153+ (170) 140 to <153 127 to <140 110 to <127 below 110 (98)
Rates of all-cause deathfigure 10.3 per 1,000 patient years, incident dialysis patients, 1995–1999 combined, adjusted for age, gender, race, & eight major comorbidities
Rates of cardiac deathfigure 10.3 per 1,000 patient years, incident dialysis patients, 1995–1999 combined, adjusted for age, gender, race, & eight major comorbidities
Rates of any cardiovascular eventfigure 10.3 per 1,000 patient years, incident dialysis patients, 1995–1999 combined, adjusted for age, gender, race, & eight major comorbidities
Patient distribution by agefigure 10.4 incident dialysis patients, 1995–1999 combined, who survive at least one year
Patient distribution by genderfigure 10.5 incident dialysis patients, 1995–1999 combined, who survive at least one year
Patient distribution, by racefigure 10.6 incident dialysis patients, 1995–1999 combined, who survive at least one year
Comorbidity at initiation of studyfigure 10.7 incident dialysis patients, 1995–1999 combined, who survive at least one year
Comorbidity at initiation of studyfigure 10.7 incident dialysis patients, 1995–1999 combined, who survive at least one year, by ASHD, CHF, Cardiac other, & CVA/TIA
Geographic variations in comorbid cardiovascular conditions: ASHDfigure 10.8 per 1,000 pt. years, group 1, 1995–1999 combined, by HSA, unadjusted Rate per 1,000 patient years at risk 561+ (594) 518 to <561 477 to <518 440 to <477 below 440 (409)
Geographic variations in comorbid cardiovascular conditions: CHFfigure 10.8 per 1,000 pt. years, group 1, 1995–1999 combined, by HSA, unadjusted Rate per 1,000 patient years at risk 605+ (630) 583 to <605 565 to <583 543 to <565 below 543 (510)
Geographic variations in comorbid cardiovascular conditions: PVDfigure 10.8 per 1,000 pt. years, group 1, 1995–1999 combined, by HSA, unadjusted Rate per 1,000 patient years at risk 591+ (609) 571 to <591 553 to <571 516 to <553 below 516 (468)
Geographic variations in comorbid cardiovascular conditions: CVA/TIAfigure 10.8 per 1,000 pt. years, group 1, 1995–1999 combined, by HSA, unadjusted Rate per 1,000 patient years at risk 226+ (236) 215 to <226 199 to <215 182 to <199 below 182 (167)
Event rates & adjusted event-free survival: acute myocardial infarctionfigure 10.9 incident dialysis patients, 1995–1999
Event rates & adjusted event-free survival: congestive heart failurefigure 10.10 incident dialysis patients, 1995–1999
Event rates & adjusted event-free survival: cardiac arrestfigure 10.11 incident dialysis patients, 1995–1999
Event rates & adjusted event-free survival: cardiac deathfigure 10.12 incident dialysis patients, 1995–1999
Event rates & adjusted event-free survival: peripheral vascular diseasefigure 10.13 incident dialysis patients, 1995–1999
Event rates & adjusted event-free survival: cerebrovascular accident/transient ischemic attackfigure 10.14 incident dialysis patients, 1995–1999
Event rates & adjusted event-free survival: coronary revascularizationfigure 10.15 incident dialysis patients, 1995–1999
Event rates & adjusted event-free survival: all cardiac eventsfigure 10.16 incident dialysis patients, 1995–1999
Event rates & adjusted event-free survival: all-cause deathfigure 10.17 incident dialysis patients, 1995–1999
Event rates & adjusted event-free survival: any cardiac event or deathfigure 10.18 incident dialysis patients, 1995–1999
Survival after acute myocardial infarctionfigure 10.19 incident dialysis patients, 1995–1999 combined
Mortality rates after acute myocardial infarctionfigure 10.20 per 1,000 patient years, incident dialysis patients, 1995–1999 combined, by HSA, unadjusted Deaths per 1,000 patient years 1,038+ (1,204) 924 to <1,038 850 to <924 782 to <850 below 782 (712)
Survival after peripheral vascular diseasefigure 10.21 incident dialysis patients, 1995–1999 combined
Survival after cerebrovascular accident/transient ischemic attackfigure 10.22 incident dialysis patients, 1995–1999 combined
Survival after cardiac arrestfigure 10.23 incident dialysis patients, 1995–1999 combined
Mortality rates after cardiac arrestfigure 10.24 per 1,000 patient years, incident dialysis patients, 1995–1999 combined, by HSA, unadjusted Deaths per 1,000 patient years 11,910+ (27,240) 5,460 to <11,910 3,070 to <5,460 1,910 to <3,070 below 1,910 (1,220)
Survival after congestive heart failurefigure 10.25 incident dialysis patients, 1995–1999 combined
Survival after coronary revascularizationfigure 10.26 incident dialysis patients, 1995–1999 combined
Event rates: acute myocardial infarctionfigure 10.27 per 1,000 patient years, prevalent dialysis patients, 1997, by HSA, unadjusted Per 1,000 patient years 81.8+ (92.4) 71.9 to <81.8 64.0 to <71.9 55.9 to <64.0 below 55.9 (50.0)
Event rates: acute myocardial infarctionfigure 10.27 per 1,000 patient years, prevalent general Medicare patients, age 65 years or older on 1/1/1997 or the 1st day of month of enrollment, by HSA, unadjusted Per 1,000 patient years 17.7+ (19.6) 16.2 to <17.7 14.9 to <16.2 12.9 to <14.9 below 12.9 (11.3)
Event rates: congestive heart failurefigure 10.28 per 1,000 patient years, prevalent dialysis patients, 1997, by HSA, unadjusted Per 1,000 patient years 472+ (569) 416 to <472 372 to <416 328 to <372 below 328 (290)
Event rates: congestive heart failurefigure 10.28 per 1,000 patient years, prevalent general Medicare patients, age 65 years or older on 1/1/1997 or the 1st day of month of enrollment, by HSA, unadjusted Per 1,000 patient years 81.3+ (90.0) 72.8 to <81.3 66.0 to <72.8 58.1 to <66.0 below 58.1 (49.7)
Event rates: cardiac arrestfigure 10.29 per 1,000 patient years, prevalent dialysis patients, 1997, by HSA, unadjusted Per 1,000 patient years 134+ (157) 115 to <134 104 to <115 94 to <104 below 94 (86)
Event rates: cardiac arrestfigure 10.29 per 1,000 patient years, prevalent general Medicare patients, age 65 years or older on 1/1/1997 or the 1st day of month of enrollment, by HSA, unadjusted Per 1,000 patient years 9.59+ (11.15) 8.17 to < 9.59 7.20 to <8.17 6.00 to <7.20 below 6.00 (5.03)
Cardiovascular first-year event ratesfigure 10.30 prevalent ESRD patients, 1997, & prevalent general Medicare patients age 65 years or older on 1/1/1997 or 1st day of the month of enrollment
Event rates: peripheral vascular diseasefigure 10.31 per 1,000 patient years, prevalent dialysis patients, 1997, by HSA, unadjusted Per 1,000 patient years 305+ (342) 275 to <305 250 to <275 226 to <250 below 226 (203)
Event rates: peripheral vascular diseasefigure 10.31 prevalent ESRD patients, 1997, & prevalent General Medicare patients age 65 years or older on 1/1/1997 or 1st day of the month of enrollment Per 1,000 patient years 58.7+ (66.8) 51.8 to <58.7 47.1 to <51.8 40.3 to <47.1 below 40.3 (34.1)
Event rates: CVA/TIAfigure 10.32 per 1,000 patient years, prevalent dialysis patients, 1997, by HSA, unadjusted Per 1,000 patient years 126+ (137) 118 to <126 111 to <118 103 to <111 below 103 (94)
Event rates: CVA/TIAfigure 10.32 prevalent ESRD patients, 1997, & prevalent general Medicare patients age 65 years or older on 1/1/1997 or 1st day of the month of enrollment Per 1,000 patient years 61.7+ (66.6) 56.3 to <61.7 50.2 to <56.3 43.6 to <50.2 below 43.6 (38.0)
Event rates: coronary revascularizationfigure 10.33 per 1,000 patient years, prevalent dialysis patients, 1997, by HSA, unadjusted Per 1,000 patient years 31.9+ (36.7) 28.6 to <31.9 26.2 to <28.6 23.2 to <26.2 below 23.2 (20.0)
Event rates: coronary revascularizationfigure 10.33 prevalent ESRD patients, 1997, & prevalent general Medicare patients age 65 years or older on 1/1/1997 or 1st day of the month of enrollment Per 1,000 patient years 15.0+ (17.0) 13.4 to <15.0 12.2 to <13.4 10.8 to <12.2 below 10.8 (9.4)
Trends in first-year event rates after transplantfigure 10.34 per 1,000 patient years, adjusted for age, gender, race, & diabetes