Download
1 / 46
460 likes | 603 Vues
This comprehensive overview examines key economic concepts including Gross Domestic Product (GDP), long-run equilibrium, and the interplay between actual and natural rates of unemployment. We analyze whether GDP growth is sustainable and how shifts in aggregate demand factors, such as consumer sentiment, fiscal and monetary policies, and global economic conditions, influence the economy. The characteristics of aggregate demand and supply curves are discussed, along with their implications for real GDP and unemployment rates.

E N D
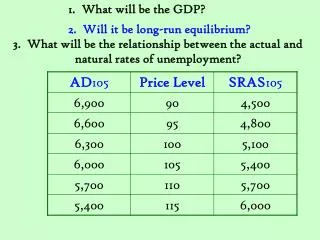
1. What will be the GDP? 2. Will it be long-run equilibrium? 3. What will be the relationship between the actual and natural rates of unemployment?
1. What will be the GDP? 2. Will it be long-run equilibrium? 3. What will be the relationship between the actual and natural rates of unemployment? 4. Will this GDP be sustainable?
Aggregate Demand for Goods & Services • Aggregate demand (AD)curve: shows the various quantities of domestically produced goods & services that purchasers are willing to buy at different price levels . • The ADcurve slopes downward to the right, indicating an inverse relationship between the amount of goods & services demanded and the price level.
AE = C + I + G + NX, P3 AE = C + I + G + NX,P2 AE = C + I + G + NX,P1 Planned aggregate expenditures(trillions of $) (AE= GDP) Output at 3 Price Levels 10.6 10.0 9.4 Output(Real GDP -- trillions of $) 45º 9.4 10.0 10.6 P3 P2 P1 AD 9.4 10.0 10.6
A reduction in the price level will increase the quantity of goods & services demanded. AD Aggregate Demand Curve PriceLevel • When the general price level in the economy declines from P1to P2, • the quantity of goods and services purchased will increase from Y1 to Y2. P1 P2 Goods & Services(real GDP) Y1 Y2
Why the AD Curve slopes down • The Wealth Effect: A lower price level increases the purchasing power of the fixed quantity of money. • The Interest Rate Effect: a lower price level will reduce the demand for money and lower the real interest rate, which then stimulates additional purchases during the current period. • The International Trade Effect: A lower price level will make domestically produced goods less expensive relative to foreign goods.
PriceLevel A reduction in the price level will increase the quantity of goods & services demanded. AD Goods & Services(real GDP) Why the AD Curve slopes down P1 P2 Y1 Y2 • A lower price level will • 1. increase the wealth of people holding the fixed quantity of money, • 2. lead to lower interest rates, and • 3. make domestic goods cheaper relative to foreign goods. • Each of these factors tends to increase the quantity of goods & services purchased at the lower price level.
Why the AD Curve shifts AD1 AD2 PriceLevel AD0 Goods & Services(real GDP)
1. Changes in Government Policies • Monetary policy • lowering interest rates reduces the cost of borrowing and increases consumption and investment.
1. Changes in Government Policies • Fiscal policy • changes in government purchases shifts the aggregate demand curve by changing the G component. Changing taxes affects the C component.
2. Changes in Economic Expectations • Optimism shifts the curve right • Pessimism shifts the curve left • Stock prices, world events affect expectations
Consumer Sentiment Index: A Measure of Optimism 1978-2007 • Consumer optimism and pessimism regarding the future of the economy. • Note how the index turns down prior to (or during) the recessions of the period. Consumer Sentiment Index 120 100 80 60 40 20 0 1994 2004 2006 1978 1980 1982 1984 1986 1988 1990 1992 1996 1998 2000 2002 Source: http://www.economagic.com.
3. Changes in Foreign Variables • Foreign economic growth • -Increased income shifts the curve right • -Decreased income shifts the curve left • -The large the trade sector, the larger the effect
3. Changes in Foreign Variables • Exchange rates • -Appreciation shifts the curve right • -Depreciation shifts the curve left
1. How will each of the following factors influence aggregate demand in the United States: • (a) An increased fear of recession. • (b) An increased fear of inflation. • (c) The rapid growth of real income in Canada and Western Europe. • (d) A reduction in the real interest rate. • (e) A higher price level (be careful). • (f) A stock market decline. Vote a for an increase in Aggregate Demand Vote b for a decrease in Aggregate Demand
The Long Run Aggregate Supply Curve In the long run, the level of real GDP is determined by the number of workers, the capital stock, and the available technology, none of which are affected by changes in the price level. Changes in the price level do not affect the level of real GDP. The level of real GDP in the long run is called potential GDP, or full-employment GDP. PriceLevel LRAS Goods & Services(real GDP) YF
Why the LRAS Curve shifts LRAS2 YF,2 PriceLevel LRAS1 Goods & Services(real GDP) YF,1 1. Changes in Resources 2. Changes in Technology 3. Institutional Changes • Minimum wage • Public policy
Why the SRAS Curve slopes up PriceLevel SRAS • Contracts make some • wages and prices Sticky Goods & Services(real GDP) 2. Firms are often slow to adjust wages • Firms are often slower to cut wages than raise them 3. Menu costs make some prices sticky
SRAS2 Why the SRAS Curve shifts PriceLevel SRAS1 Goods & Services(real GDP) 1. Increases in the Labor Force and in Capital Stock 2. Technological Changes
Why the SRAS Curve shifts 3. Changes in Expected Rate of Inflation • Expected higher reduces supply • Expected lower increases supply
Why the SRAS Curve shifts 4. Adjustments to Errors in Past Expectations about the Price Level • If workers and firms are adjusting to prices being higher than expected the curve will shift left. b. If they are adjusting to prices being lower than expected the curve will shift right.
Why the SRAS Curve shifts 5. Expected Changes in Resource Prices
Why the SRAS Curve shifts 6. Supply Shocks An unexpected event that causes the SRAS to shift.
2. How will each of the following factors influence aggregate supply in the Short Run: • (a) An increase in real wages. • (b) 4 hurricanes that destroy half of the orange crop in Florida. • (c) An increase in the expected rate of inflation. • (d) An increase in the world price of oil. • (e) Abundant rainfall during the growing season. Vote a for an increase in Aggregate Supply Vote b for a decrease in Aggregate Supply
LRAS2 SRAS2 Growth in Aggregate Supply LRAS1 PriceLevel SRAS1 P100 P95 AD Goods & Services(real GDP) YF2 YF1 • Start with Equilibrium, then increase LRAS (How?). • Both LRAS and SRAS increase full employment output expands from YF1 to YF2. • A sustainable, higher level of real output is the result.
Prices are high relative to production costs • Unanticipated increase in AD. • Supply shock • Increased output is unsustainable Economic Booms
Short-run effects of an unanticipatedincrease in AD AD2 Unanticipated Changes in Aggregate Demand Increases PriceLevel LRAS SRAS1 P105 P100 • Improves profits. • Output increases AD1 Goods & Services(real GDP) Y2 YF • Unemployment drops below the natural rate,
SRAS2 Long-run effects of an unanticipatedincrease in AD but... PriceLevel LRAS SRAS1 P110 P105 P105 AD2 AD1 Goods & Services(real GDP) YF Y2 YF • Resource prices will rise. (SRAS shifts) • Output will recede to the long-run potential.
Recessions • Prices are low relative to production costs • Unanticipated decrease in AD. • Supply shock • Causes losses, so production decreases
Decreases Short-run effects of an unanticipatedreduction in AD AD2 PriceLevel LRAS SRAS1 P100 P95 AD1 Goods & Services(real GDP) Y2 YF • Profits fall. • Output decreases • Unemployment rises,
SRAS2 Long-run effects of an unanticipatedreduction in AD then... PriceLevel LRAS SRAS1 P100 P95 P90 AD1 AD2 Goods & Services(real GDP) YF Y2 YF • Resource prices adjust down. (SRAS shifts) • Output will recede to the long-run potential.
Unanticipated Changes in Supply SRAS2 PriceLevel LRAS SRAS1 • Due to some favorable supply shock P100 P95 AD Goods & Services(real GDP) Y2 YF • Prices fall • Output increases • But conditions return to normal SRAS shifts back
S2 Decrease in SRAS ResourceMarket PriceLevel S1 Pr2 Pr1 D Quantity of resources Q2 Q1 • An adverse supply shock, (crop failure or oil price increase) • prices rise from Pr1 to Pr2.
SRAS2 (Pr2 ) Decrease in SRAS PriceLevel LRAS SRAS1 (Pr1 ) P110 P100 AD Goods & Services(real GDP) Y2 YF • The higher resource prices shift SRAS to the left • the price level rises to P110and output falls to Y2. • What happens in the long-run depends on whether the supply shock is temporary or permanent.
SRAS1 (Pr1 ) B A PriceLevel SRAS2 (Pr2 ) Decrease in SRAS LRAS P110 P100 AD Goods & Services(real GDP) Y2 YF • If temporary, resource prices fall in the future, shifting SRAS2 back to SRAS1, returning equilibrium to (A). • If permanent, the productive potential of the economy will shrink (LRASshifts left andY2becomesYF2) and (B) will become the long-run equilibrium.
How Long Does It Take to Return to Potential GDP? Economic Forecasts Following the Recession of 2007–2009
Price Level, Inflation, and the AD-AS Model The actual price level will also differ from the level people anticipated when the rate of inflation differs from what is expected. • When the inflation rate is greater than anticipated, profit margins will be attractive and business firms will respond with an expansion in output. • When the inflation rate is less than anticipated, profit margins will be unattractive and businesses will reduce their output.
Which way will the AS or AD curves move after: A. A widespread fear of depression on the part of consumers. B. A large purchase of American wheat by Russia. C. A cut in Federal spending for health care. D. The complete disintegration of OPEC, causing oil prices to fall by one-half. E. A 10 percent reduction in personal income taxes. F. An increase in labor productivity. G. Depreciation in the international value of the dollar. H. A decline in the percentage of the American labor force which is unionized.
SRAS AD Y Y F F H. A decline in the percentage of the American labor force which is unionized. D. The complete disintegration of OPEC, causing oil prices to fall by one-half. A. A widespread fear of depression on the part of consumers. B. A large purchase of American wheat by Russia. C. A cut in Federal spending for health care. G. Depreciation in the international value of the dollar. F. An increase in labor productivity. E. A 10 percent reduction in personal income taxes. Price level LRAS Price level P Employment GDP Goods &Services(real GDP)
Expansions, Recessions, & Unemployment Recessions: Actual rate ofunemployment Natural rate ofunemployment Real GDP (billions of 1996 $) 9,000 • Expansion and contraction in the U.S. economy since 1960. 8,000 6,000 2001 1990 4,000 1982 1980 1974-75 2,000 • Reductions in real GDP in the top graph relate with increases in the rate of unemployment above the natural rate (bottom graph). 1970 1960 1960 1965 1970 1975 1980 1985 1990 1995 2000 % Labor force unemployed 10 % 8 % 6 % 4 % 2 % 1960 1965 1970 1975 1980 1985 1990 1995 2000 Source: Derived from computerized data supplied by FAME Economics.
The Recession of 2007-2009 1. The end of the housing bubble. A speculative bubble contributed to the rapidly rising housing prices between 2002 and 2005 before deflating in 2006, as both new home sales and existing home values began to decline. The growth of aggregate demand slowed as spending on residential construction fell more than 60 percent over the next four years. 2. The financial crisis. The financial crisis led to a “credit crunch” that made it difficult for many households and firms to obtain the loans they needed to finance their spending, which contributed to declines in consumption spending and investment spending. 3. The rapid increase in oil prices during 2008. Although rising oil prices can result in a supply shock that causes the short-run aggregate supply curve to shift to the left, it did not shift as far to the left during 2008 as it had from the increases in oil prices 30 years earlier because many firms had since switched to less oil-dependent production processes.
The Beginning of the Recession of 2007–2009 2007 - 2008, the AD curveshifted to the right, but not by nearly enough to offset the shift to the right of the LRAS curve, which represented the increase in potential real GDP from $13.20 trillion to $13.51 trillion. Because of a sharp increase in oil prices, short-run aggregate supply shifted to the left, from SRAS2007to SRAS2008. Real GDPdecreased from $13.21 trillion in 2007 to $13.16 trillion in 2008, which was far below the potential real GDP, shown by LRAS2008. As a result, the unemployment rate rose from 4.6 percent in 2007 to 5.8 percent in 2008. Because the increase in aggregate demand was small, the price level increased only from 106.2 in 2007 to 108.6 in 2008, so the inflation rate for 2008 was only 2.3 percent.
1. Which of the following would be most likely to cause an increase in current aggregate demand in the United States? a. increased fear that the U.S. economy was going into a recession b.an increase in the real interest rate c. sharp increase in the value of stocks owned by Americans d.a recession in Canada, Mexico, and Western Europe 2. Which of the following will most likely accompany an unanticipated increase in aggregate demand? a. an increase in real output b.an increase in unemployment c. a decrease in real GDP d.a decrease in the demand for resources 3. In the aggregate demand/aggregate supply model, when the output of an economy is less than its long-run potential, the economy will experience a. declining real wages and interest rates that will stimulate employment and real output. b.rising interest rates that will stimulate aggregate demand and restore full employment. c. a budget surplus that will stimulate demand and, thereby, help restore full employment. d. rising real wages and real interest rates that will restore equilibrium at a higher price level.
4. Which of the following will most likely result from an unanticipated decrease in aggregate supply due to unfavorable weather conditions in agricultural areas? a. a decrease in inflation b. a decrease in unemployment c. an increase in the general level of prices d. an increase in the natural rate of unemployment 5. Which of the following will most likely increase aggregate supply in the long run? a. unfavorable weather conditions in agricultural areas b. an increase in the expected inflation rate c. higher real interest rates d. an increase in the rate of capital formation 6.Within the AD/AS model, an unanticipated increase in short-run aggregate supply will cause real output to a. increase and the general level of prices to fall. b. decrease and the general level of prices to rise. c. increase and the general level of prices to rise. d. decrease and the general level of prices to fall.
7. An increase in the long-run aggregate supply curve indicates that a. the natural rate of unemployment has increased. b. unemployment has increased. c. the general level of prices has increased. d. potential real GDP has increased. 8. If the general level of prices is lower than business decision makers anticipated when they entered into long-term contracts for raw materials and other resources, which of the following is most likely to occur? a. an economic boom b. highly attractive profit margins c. output less than the economy’s long-run potential d. a sharp increase in imports 9. When output is less than the economy’s long-run capacity, which of the following is most likely to occur? a. an abnormally low rate of unemployment b. reductions in real interest rates and real resource prices c. a sharp increase in imports d. a government budget surplus
10. Suppose there was a sharp reduction in stock prices and a sharp increase in the world price of crude oil. Within the framework of the AD/AS model, how would these two changes influence the U.S. economy? a. The lower stock prices would increase SRAS, and the higher crude oil prices would reduce AD; as a result, there would be downward pressure on the general level of prices. b. The lower stock prices would reduce SRAS, and the higher crude oil prices would increase AD; as a result, there would be upward pressure on the general level of prices. c. The lower stock prices would increase AD, and the higher crude oil prices would increase SRAS; as a result, output would tend to increase. d. The lower stock prices would reduce AD, and the higher crude oil prices would reduce SRAS; as a result, output would tend to decline.