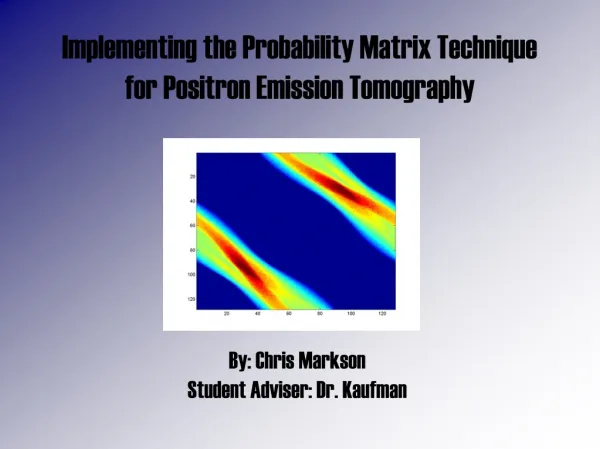
Download
1 / 54
540 likes | 664 Vues
This study explores the accretion disk structure in SS Cygni using Doppler tomography, comparing observational data with gas dynamic simulations to identify flow features. The research involves observations, synthetic Doppler maps, and gas dynamic simulations.

E N D
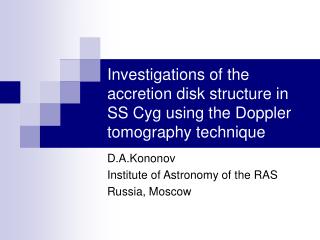
Investigations of the accretion disk structure in SS Cyg using the Doppler tomography technique D.A.Kononov Institute of Astronomy of the RAS Russia, Moscow
Close binary systems are interesting from the observational point of view as well as from the point of view of studying physical processes running in the systems. • The bulk of the emission are caused by accretion and processes taking place in the accretion disc and in the circumbinary envelope.
Gas dynamical features are difficult to be observed directly because the systems are small and are not to be resolved from direct observations. • How might one cope with this problem?
The method of Doppler tomography • Radon transform • - normalized local profile
Unfortunately direct transform from velocities to coordinates is impossible without initial assumptions about the density, temperature and velocity distribution.
Unfortunately direct transform from velocities to coordinates is impossible without initial assumptions about the density, temperature and velocity distribution. • I(Vx,Vy) → I(x,y) – impossible.
Unfortunately direct transform from velocities to coordinates is impossible without initial assumptions about the density, temperature and velocity distribution. • I(Vx,Vy) → I(x,y) – impossible. • However, we can easily turn the numerically calculated distribution of the intensity from the coordinate frame into the velocity frame.
Unfortunately direct transform from velocities to coordinates is impossible without initial assumptions about the density, temperature and velocity distribution. • I(Vx,Vy) → I(x,y) – impossible. • However, we can easily turn the numerically calculated distribution of the intensity from the coordinate frame into the velocity frame. • I(x,y) → I(Vx,Vy) – possible.
In our work we have started from observations and transform them to observational Doppler tomograms. At the same time we performed gas dynamic simulations of the system and computed a synthetic Doppler map. Comparison of the synthetic map with the observational tomograms allows us to identify the main features of the flow structure.
Primary Secondary • WD Red Dwarf (K 4.5 V) • M ≈ 0.97M๏ M ≈ 0.56M๏ • Teff ≈30000 K Teff ≈ 3500 K • Ṁ ≈ 10-9-10-8 M๏/year • A ≈ 2.05 R๏ • P ≈ 6.6 h
2 meter telescope Ziess-2000 in the Terskol Observatory. • Classical spectrograph in the Cassegrain focus • Dates of observations:2006/08/05, 2006/12/08, 2006/12/10, 2006/12/13 (outbursts), 2006/08/14 (quiescence) • Exposure times τ = 10 min (2006/08/05), τ = 15 min (all other dates) • Lines: Hα, Hβ, Hγ
Density distribution in the equatorial plane and the velosity vectors
Identification of the main gas dynamic features in SS Cyg in quiescence.
Synthetic Doppler map Intensity distribution in the equatorial plane
Synthetic Doppler map Intensity distribution in the equatorial plane
Synthetic Doppler map Intensity distribution in the equatorial plane
Synthetic Doppler map Intensity distribution in the equatorial plane
Synthetic Doppler map Intensity distribution in the equatorial plane
Synthetic Doppler map Intensity distribution in the equatorial plane
Synthetic Doppler map Intensity distribution in the equatorial plane
Synthetic Doppler map Intensity distribution in the equatorial plane
H g
H b
Observational data analysisProfiles of the Hα,Hβ and Hγ lines
Observational data analysisOrbital evolution of the line profiles
Observational data analysisOrbital evolution of the line profiles
Observational data analysis Long term line profiles evolution