Download

1 / 30
320 likes | 527 Vues
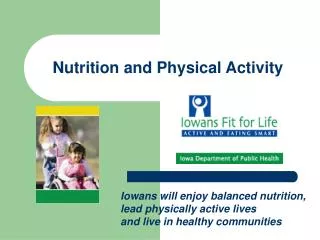
Nutrition and Physical Activity. Iowans will enjoy balanced nutrition, lead physically active lives and live in healthy communities . Promoting Nutrition & Physical Activity . CDC Planning Grant. CDC’s Charge. Write a comprehensive state plan, involving a wide range of community partners

E N D
Nutrition and Physical Activity Iowans will enjoy balanced nutrition, lead physically active lives and live in healthy communities
Promoting Nutrition & Physical Activity CDC Planning Grant
CDC’s Charge • Write a comprehensive state plan, involving a wide range of community partners • Describe the plan in terms of the social-ecological model • Base plan on science-based interventions or promising interventions
Public Health Approach to Obesity, Physical Activity & Nutrition • Outreach & education • to inform public • to inform and prepare providers • Describe Problem • Burden • Identify at risk populations • Identify contributing factors Evaluate & improve programs Work with communities for systems change
Scope of Activities • Conduct Community Forums • Visit with professionals at conferences & meetings • Invite partners to a Kick Off Summit to begin process of writing a plan • Form Channel Work Groups to write portions of the plan
Behavior Change Strategies • Increase breastfeeding initiation and duration • Reduce TV viewing • Increase physical activity • Increase fruit and vegetable consumption • Other dietary changes such as decreasing soft drink intake or reducing portion sizes • Increase parental involvement, but not parental control
The Epidemic • The prevalence of obesity among Iowa adults has increased by 84% from 1990 to 2004 (Behavioral Risk Factor Surveillance System BRFSS). • The 2004 BRFSS data indicates 37.4% of adult Iowans are overweight, and 23.5% are obese (for a total of 61% of Iowa adults compared to the national average of 59.9%)
Disparities • 31% of low-income children between 2 and 5 years of age in Iowa are overweight or at risk of becoming overweight. (CDC PedNSS, 2003) • Overweight and obesity prevalence rises with increasing age in Iowa up to age 64. • Obesity prevalence is highest (28.2%) in those with income less than $15,000. • Ethnicity data not available for Iowa
National Data on Adult Obesity: 1988-94 to 1999-2000 2010 Target 1988-94 Total White Female Male Black Female Male Mexican American Female Male 0 10 20 30 40 50 Percent Note: Data are for ages 20 years and over, age adjusted to the 2000 standard population. Obesity is defined as BMI >= 30.0. Black and white exclude persons of Hispanic origin. Persons of Mexican-American origin may be any race. Source: National Health and Nutrition Examination Survey, NCHS, CDC. Obj. 19-2
Early ChildhoodIowa PedNSS 2003 • 31% of low-income children 2-5 years of age in Iowa are overweight or at risk of becoming overweight. • Overweight: 13.6% vs. 14.7% U.S. • Ever Breastfed: 60% vs. 53.2% U.S. • Breastfed 6 months: 27.5% vs. 21.5% U.S.
National Trends in Child and Adolescent Overweight Percent Percent Males 12-19 Males 6-11 Females 12-19 Females 6-11 1963-67 1971-74 1976-80 1988-94 1999-2000 1966-70 Note: Overweight is defined as BMI >= gender- and weight-specific 95th percentile from the 2000 CDC Growth Charts for the United States. Source: National Health Examination Surveys II (ages 6-11) and III (ages 12-17), National Health and Nutrition Examination Surveys I, II, III and 1999-2000, NCHS, CDC. Obj. 19-2
Prevalence of Overweight of 4th, 5th, and 6th grade youth in the UNI PANARY surveillance project • Measured BMI of 2,740 4th – 6th grade children • 60% were in the normal weight zone (70% U.S.) • 20% were in the “at risk for overweight” zone (16% U.S.) • 20% were in the “overweight” zone (15% U.S.) Joens-Matre, Welk, Russell, Nicklay, & Hensley (2005). Medicine and Science in Sports and Exercise. May Supplement.
Prevalence of Overweight of 4th, 5th, and 6th grade youth from Urban, Small Cities, and Rural areas in the PANARY surveillance project (Joens-Matre, Welk, Russell, Nicklay, & Hensley, 2005)
National Child and Adolescent Overweight by Race: 1988-94 to 1999-2000 2010 Target 1988-94 Total White Black Mexican American Female Male 0 10 20 30 Percent Note: Overweight is defined for ages 6-19 years as BMI >= gender- and weight-specific 95th percentile from the 2000 CDC Growth Charts for the United States Black and white exclude persons of Hispanic origin. Persons of Mexican-American origin may be any race. Source: National Health and Nutrition Examination Survey, NCHS, CDC. Obj. 19-3c
Iowa 2003-Consumption of Fruits and Vegetables Consume 5 or more servings per day • 17% of Iowa adults • 23.6% of older adults • 19% of adults with income < $15,000 • 11.3% of adults without a HS/GED degree • 22% of US adults
Fried potatoes Fried potatoes 22% Other 46% Tomatoes potatoes 11% 13% Tomatoes Legumes Other Dark green/ 9% 8% potatoes orange 10% Legumes Dark 11% 6% All others All others green/ 22% 35% orange 8% National Proportion of Vegetable Servings 1999-2000 Children 2-19 years Adults 20 years and over Target = At least 1/3 dark green/orange Note: Data are age adjusted to the 2000 standard population for adults 20 years and over. Source: National Health and Nutrition Examination Survey, NCHS, CDC. Obj. 19-6
Fruits and Vegetables: U.S. Average Number of Daily Servings by Race: 1999-2000 White Black Mexican American Average number of servings Total Minimum Recommended Vegetables Fruits Note: Data are age-adjusted to the 2000 standard population for ages 2 years and over. Black and white exclude persons of Hispanic origin. Persons of Mexican-American origin may be any race. Source: National Health and Nutrition Examination Survey, NCHS, CDC. Objs. 19-5 19-6
Iowa 2003-Meet the recommended amount of physical activity • 43% of Iowa adults (Men- 45%; Women- 42%) • 32% of older adults • 38% of adults with income < $15,000 • 36% of adults without a HS/GED degree • 47% of U.S. adults meet the recommended amount of physical activity
Moderate Physical Activity for U.S. Adults by Race/Ethnicity 2010 Target American Indian 1999 Asian 2002 Black White Hispanic 30 0 10 20 40 50 Age-adjusted percent Note: Data are for ages 18 years and over, age adjusted to the 2000 standard population. Moderate physical activity is regular leisure-time physical activity (moderate activity 30+ minutes/5+ times a week or vigorous activity 20+ minutes/3+ times a week). American Indian includes Alaska Native. Black and white exclude persons of Hispanic origin. Persons of Hispanic origin may be any race. I = 95% confidence interval. Source: National Health Interview Survey, NCHS, CDC. Obj. 22-2
Vigorous Physical Activity for U. S. Adolescents by Grade Level: 2001 Percent 10th 9th 11th 12th Note: Vigorous physical activity is activity that made students in grades 9-12 sweat or breathe hard for 20+ minutes on 3+ of the past 7 days. I = 95% confidence interval. Source: Youth Risk Behavior Surveillance System, NCCDPHP, CDC. Obj. 22-7
Cost of Overweight • Today’s children will be the first generation in memory to have a shorter life span than their parents. - Sir John Krebs, Chairman of the United Kingdom’s Food Standards agency • Iowans pay $783 million in health care costs for problems associated with obesity - ~17% is covered by Medicaid & Medicare (Finkelstein, Fiebelkorn, & Wang, 2004) • Overweight children report lower quality of life than children with cancer.
Community Forum Suggestions • Banning/restricting access to vending machines during school hours would help curb obesity.
Community Forum Suggestions • More time should be allotted for physical education. • Schools should devote more time to promoting healthy lifestyles.
Community Forum Suggestions • Increase the awareness about all the resources available in each city/county. • Develop a health coalition for each county.
Community Forum Suggestions • Promote one major event every 6 months such as a “Kids Walk-to-School” event in October and a “No T.V. Week” in April. • Develop school district wellness committees. New school wellness policy needs to be in place by the 2006-2007 school year.