Download
1 / 40
400 likes | 405 Vues
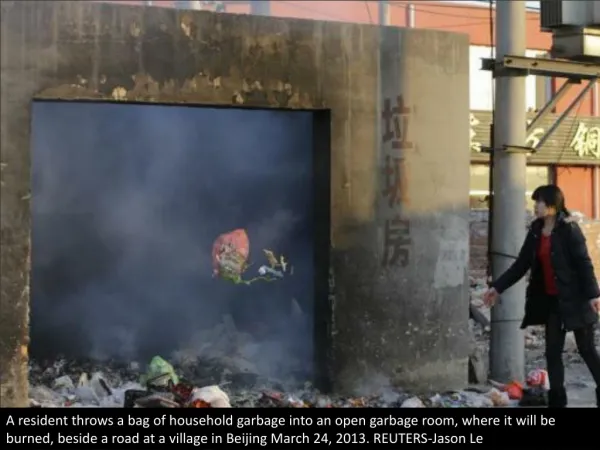
Remote Sensing and Emission Inventory: the best of the two world December 4-5, 2007. Economic Development and Air Pollution in Megacities of China. Shxiao Wang Tsinghua University December 4, 2007. Economic Development, Energy Consumption, and Emissions.

E N D
Remote Sensing and Emission Inventory: the best of the two world December 4-5, 2007 Economic Development and Air Pollution in Megacities of China Shxiao Wang Tsinghua University December 4, 2007
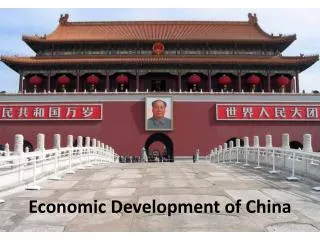
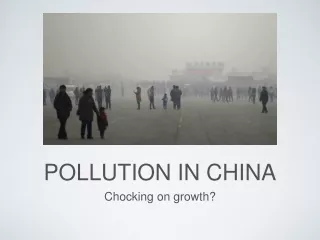
China has experienced rapid economic growth in last 20 years
Fast Increase of Energy Intensive Industry: ~20 times in last 25 years Million tons
79 cities 43 cities 25 cities City clusters are playing a leading role in Chinese economic growth
Growth of Emissions in last 10 Years NOx: 1.8 times SO2:1.5 times
Energy consumption have increased since 2000, which is the important reason of emission increases 2000 2005 Mobile Sources Ref: National Bureau of Statistics of China. China Statistical Yearbook
SO2 emissions 2000: 21,266kt; 2005: 29,901kt Total Emissions By sector
SO2 emissions increased to 29.9Mt in 2005, mainly in Hebei, Shandong, Zhejiang, Jiangsu By province
NOx emissions Total Emissions 2000: 10,706kt; 2005: 17,123kt By sector
NOx emissions increased to 17.1 Mt in 2005, mainly in Hebei, Shanxi, Shandong, Zhejiang, Jiangsu, Guangdong By Province
PM2.5 emissions Total Emissions 2000: 12,662kt; 2005: 16,049kt By Sector
PM2.5 emissions increased to 16Mt in 2005, mainly in Hebei, Shandong, Shanxi, Guangdong
Spatial Distribution of Emissions, 2005 NOx, VOCs, Fine PM: Beijing-Tianjin-Bohai Bay Yangtze River Delta Pearl River Delta SO2 NOx PM10 VOCs PM2.5 CO
北京市空气质量——现状 Trends of Air Quality in Beijing Ambient air quality in urban area has been improved since 1998 Days meeting NAAQS Class II Number of days with heavy pollution Source: Beijing EPB
Ambient Air Quality in Beijing Trends of Air Quality in Beijing SO2 : 25% CO:22% NO2: 7% PM10: 0.6% mg/m3 mg/m3
Atmospheric Observation Sites Miyun (MY) Changping (CHP) Tsinghua (THU) Chegongzhuang (ZGC)
Ambient Air Quality in Beijing PM2.5: 60%of PM10 at Tsinghua
1999 2000 2001 2002 2003 2004 2005 2006 Ambient Air Quality in Beijing Weekly Average Concentration of PM2.5 in Beijing: 1999-2006 • PM2.5 mass levels range from 20 to 350 g m-3, averagely 114 g m-3 • 40% of the weekly concentrations exceeded 100g m-3 at THU
Beijing naturalruralnear-cityurban kerbside Ambient Air Quality in Beijing PM2.5 in Beijing
Ambient Air Quality in Beijing National Standard: 200ug/m3 (1 hr) O3 nonattainment days O3 nonattainment hours O3 pollution has not been obviously mitigated. Source: Beijing EPB
Ambient Air Quality in BeijingO3 • data resources: BJEPB & Tao Wang
The trend of regional air pollution in YRD:SO2 pollution level in the cities in 2005 was higher than 2000
Trends of Air Quality in Shanghai D:\Changhong CHEN\上海市社会经济指标\环境空气质量\大气监测月平均_修改稿_潘汉生.xls
Trend of air pollution in Shanghai:SO2, NO2 concentrations and the frequency of acid rain keeps increasing in the past years from 2000 to 2005 Trend of air pollution in JIANGSU:SO2 concentration and the frequency of acid rain remains increasing in the past years from 2000 to 2005
PM10 in a normal day MODIS Courtesy of Mr. Esmond Lee
PM10 Heavy Pollution Days • Nov 2, 2003. API: • GZ: 303 • SZ: 92 • HK: 126 MODIS MODIS • Nov 1, 2003. API: • GZ: 154 • SZ: 87 • HK: 86 Courtesy of Mr. Esmond Lee
Visibility in Pearl River Delta (1991-2003) • % of visibility less than 8 km • Hong Kong • Shenzhen • Macau Courtesy of Prof. Tang XY
Haze in Guangzhou City Courtesy of Guangdong EPB
O3 Pollution in PRD maximum, minimum and average O3 concentrations between Dec. 2005 and Jun. 2006 Courtesy of Guangdong EPB