Download
1 / 14
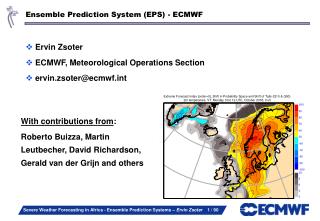
140 likes | 325 Vues
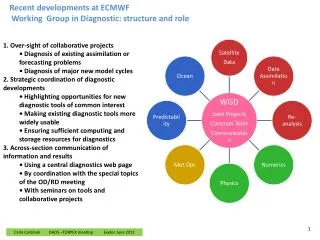
1. Over-sight of collaborative projects • Diagnosis of existing assimilation or forecasting problems • Diagnosis of major new model cycles 2. Strategic coordination of diagnostic developments • Highlighting opportunities for new diagnostic tools of common interest

E N D
1. Over-sight of collaborative projects • • Diagnosis of existing assimilation or forecasting problems • • Diagnosis of major new model cycles • 2. Strategic coordination of diagnostic developments • • Highlighting opportunities for new diagnostic tools of common interest • • Making existing diagnostic tools more widely usable • • Ensuring sufficient computing and storage resources for diagnostics • 3. Across-section communication of information and results • • Using a central diagnostics web page • • By coordination with the special topics of the OD/RD meeting • • With seminars on tools and collaborative projects Recent developments at ECMWFWorking Group in Diagnostic: structure and role Carla Cardinali DAOS –TORPEX meeting Exeter June 2011
Trouble shooting: Spring scores investigation • Diagnostics and investigation are underway to address the issue of a number “of” busts in Spring.
airep pilot temp amv
pilot airep temp amv
The largest degradation follow the amplification of the ridge
Land surface data assimilation evolution Patricia de Rosnay et al 1999 2004 2009 2010/2011 Optimum Interpolation (OI) Screen Level Analysis Douville et al. (2000) Mahfouf et al. (2000) Soil moisture analysis based on Temperature and relative humidity analysis Revised snow analysis Drusch et al. (2004) Cressman snow depth analysis using SYNOP data improved by using NOAA / NSEDIS Snow cover extend data Structure Surface Analysis: • OI snow analysis and high resolution NESDIS data (4km) • SEKF Soil Moisture analysis • Simplified Extended Kalman Filter • METOP-ASCAT SMOS Recent developments/implementations: • SEKF surface analysis • Use of active microwave data: ASCAT soil moisture product • Use of passive microwave SMOS Brightness Temperature product • New snow analysis and use of NOAA/NESDIS 4km snow cover product De Rosnay et al., ECMWF NewsLetter, 2011 Sabateret al., ECMWF NewsLetter, 2011
EKF soil moisture analysis • For each grid point, Analysed soil moisture state vector θa: θa(t) = θb(t) + K (y(t)-H θb(t)) θb Background soil moisture state vector Dimension Nx (=3, for the top three layers analysed), y Observation vector , Dimension Ny (=2 when T2m and Rh2m are used) • HJacobian matrix of the observation operator • Estimated in finite differences (perturbed simulations) • Dimension Nxraws, Ny columns KKalman gain matrix, fn of H and covariance matrix of background Bg (Nx . Nx) and observation R (Ny.Ny) errors. Relevant Observations: • Used in operations: Conventional observations (T2m, RH2m) • Used in research: ASCAT Soil Moisture • Under development: SMOS Brightness temperature EKF corrects the trajectory of the Land Surface Model
ECMWF Soil Moisture Analysis verification Albergel Clement • Validated for several sites across Europe (Italy, France, Spain, Belgium) • Validation results in FranceDec 2008- Dec 2009 Verification of ECMWF SM over the SMOSMANIA Network
Snow analysis • Snow analysis uses SYNOP snow depth data and NOAA/NESDIS IMS snow cover • 2010 implementation: • New Snow analysis based on the Optimum Interpolation with Brasnett 1999 structure functions • A new IMS 4km snow cover product to replace the 24km product • Improved QC (monitoring, Blacklisting) 2011: - Assimilate additional snow data From Sweden (New Report Type) cm New Surface data SYNOPdata
Direct 4D-Var assimilation of NCEP Stage IV rain data (Lopez 2011, MWR, in press) • Ingredients: • Data:NCEP Stage IV radar + gauge precipitation product (4-km resol.). • Data are averaged to model resolution prior to assimilation. • Domain: eastern USA. • 6-hourly accumulations are assimilated smoother & more linear. • Ln(RR6h[mm/h]+1) transform (background departures closer to Gaussian). • Screening: • Obs rejected in regions with steep orography, surface snowfall or ducting. • Only points that are rainy in both background and obs are assimilated. • Fixed observation error: o=0.2 (in log-space). • Variational bias correction implemented. ECMWF 2011
Direct 4D-Var assimilation of NCEP Stage IV rain data Short-range precipitation forecast is significantly improved.. 12h-accumulated precipitation FC 00Z+12h (T511 L91) Sept-Oct 2009 April-May 2009 Equitable Threat Score Equitable Threat Score False Alarm Rate False Alarm Rate ECMWF 2011
Impact of NCEP Stage IV assimilation on 12h forecasts of precipitation. Sept-Oct 2009 average (CY35R2; T511 L91) NCEP Stage IV obs (mm/day) CTRL – NCEP Stage IV Mean bias and RMS error are reduced NEW – NCEP Stage IV ECMWF 2011
Direct 4D-Var assimilation of NCEP Stage IV rain data ECMWF 2011 Impact on forecast scores for other parameters (Z, T, wind, RH): - neutral or slightly positive impact on the global scale. - some hint of positive impact over Europe (days 4-5) and Asia (days 8-10). RMSE North. Hemis. 500hPa wind RMSE Europe 500hPa temperature Forecast Root Mean Square Error changes due to direct 4D-Var assimilation of NCEP Stage IV rain data 1 April – 6 June 2010, T1279 (~15 km global) L91 good RMSE South. Hemis. 500hPa wind RMSE Asia 850hPa Temperature
EDA • The EDA system is designed to provide estimates of analysis and background uncertainty • This has intrinsic value as an estimate of the quality of the deterministic analysis (i.e., Re-analysis applications, synoptic evaluation,…) • It improves the representation of initial uncertainties in the Ensemble Prediction System • It is used to estimate state-dependent background error variancesin the deterministic 4D-Var