Nitrogen Cycle
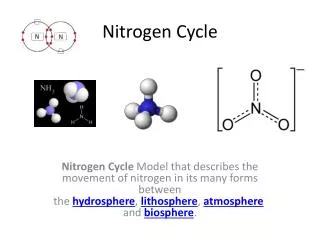
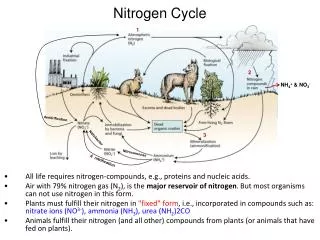
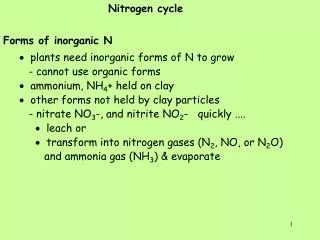
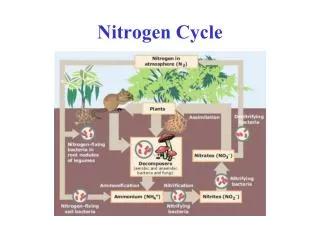
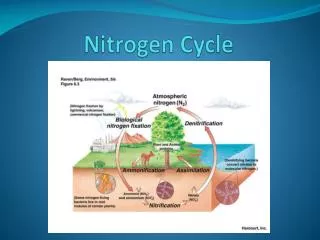
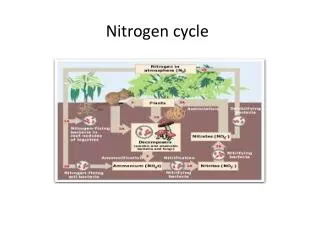
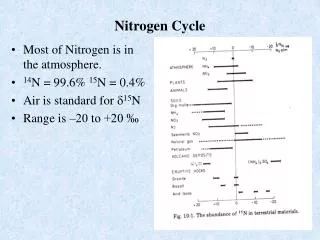
Nitrogen Cycle. Most of Nitrogen is in the atmosphere. 14 N = 99.6% 15 N = 0.4% Air is standard for d 15 N Range is –20 to +20 ‰. Assimilation and Dissimilation Nitrogen Cycling Pathways. Assimilation NO 3 and NH 4 uptake (NO 3 or NH 4 org N) N 2 Fixation (N 2 org N)

Nitrogen Cycle
E N D
Presentation Transcript
Nitrogen Cycle • Most of Nitrogen is in the atmosphere. • 14N = 99.6% 15N = 0.4% • Air is standard for d15N • Range is –20 to +20 ‰
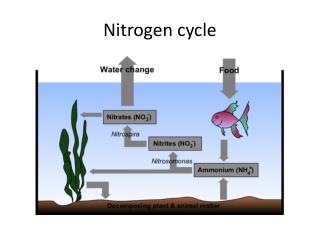
Assimilation and Dissimilation Nitrogen Cycling Pathways Assimilation NO3 and NH4 uptake (NO3 or NH4 org N) N2 Fixation (N2 org N) Dissimilation -Mineralization (org N NH4) -Nitrification (NH4 NO3) -Denitrification (NO3 N2) -Annamox (NO2 + NH4 N2) (in marine systems)
d15N Range in Terrestrial Plants Non N-fixers = -6 to +6 ‰ N-Fixers = 0±3 ‰
KIE during Nitrate Assimilation by Terrestrial Plants • Large range of KIE values measured in culture experiments • Range: - 3 to –24 ‰ (Mariotti, 1980) -3 to –7 ‰ (Kohl and Shearer, 1980) -0.3±0.6 ‰ (38 species) (Mariotti, 1982) • Measured KIE depends significantly on culture conditions (growth rate, NO3 concentration) • Typically, KIE increased with increased nitrate concentration.
N2 Fixation in Plants • Plants have d15N = 0±3 ‰ similar to d15N of N2 in air. -molecular diffusion of N2 is air (soil pockets) yields KIE = -9 ‰. N2 diffusion in water has KIE = -1.3 ‰ -also you would expect a significant KIE during the breaking of a N-N bond to convert to NH4 -this seems to imply that aqueous N2 diffusion limits N2 fixation. What other explanation? • Haber Process (N2 + 3H2 2NH3) yields commercial fertilizers with d15N of ~ 0±3 ‰ (high temp (>300ºC) and complete conversionlittle KIE)
KIE during NO3 and NH4 Uptake in Plankton Cultures KIE ranged from 0 to –15 ‰ with a mean of ~ –7 ‰
Effect of growth rate of KIE in cultures NO3 Substrate NO3 Substrate NH4 Substrate + A A As growth rate increased, KIE decreased. High concentrations (mmolar) of NO3 and NH4.
KIE during N2, NO3 and NH4 uptake (same species Anabaena) KIEs N2 = -2 ‰ NO3 = -11 to –13 ‰ NH4 = -14 ‰
KIE during NO3 assimilation under closer to ambient concentrations (uM vs mM)
d15N variations in marine plankton Three Ocean Regimes NO3 replete (I) NO3 limited (II) N2 fixation (III)
d15N of Plankton (PON) in Mixed Layer depends on NO3 Concentration
Effect of KIE on d15N of NO3 Sta Papa Southern Ocean KIE during nitrate assimilation enriches d15N of remaining NO3 pool Both regions yields a KIE = -9.1 ‰. What is advantage of this approach?
d15N of NH4 in Delaware Estuary KIE for NH4 uptake = -20±? ‰ (Rayleigh)
Steps in nitrate assimilation ~15 ‰ offset between internal and external NO3 pools
d15N based N Budget at ALOHA and BATS ALOHA near Hawaii BATS near Bermuda At ALOHA, N2 fixation contributes 50% of new nitrogen. At BATS, N2 fixation is a negligible N source.