Download
1 / 56
560 likes | 714 Vues
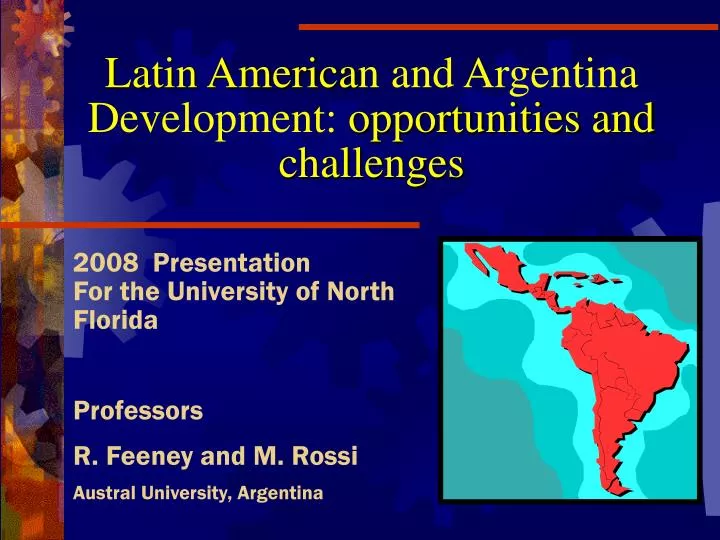
Latin America n and Argentina Development: opportunities and challenges. 2008 Presentation For the University of North Florida Professors R. Feeney and M. Rossi Austral University, Argentina. Some facts about Latin America. 44 countries

E N D
Latin American and Argentina Development: opportunities and challenges 2008 PresentationFor the University of North Florida Professors R. Feeney and M. Rossi Austral University, Argentina
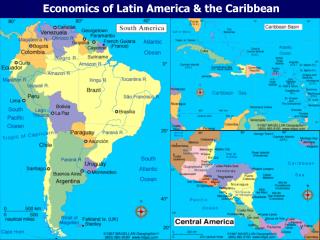
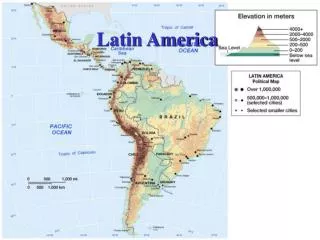
Some facts about Latin America • 44 countries • 550 million people live in this region(50% more than the US, 8% of world population) • It produces 7% of the world GDP (one third of the US) • Its territory is 21 million square kms (double than de US) • Major world provider of soja, copper, sugar, beef, etc. and many other raw materials • 25 uninterrupted years of democratic regimes in most of the countries
Evolution of the world GDP per Capita (PPP) 1950-2003 US, Can, NZ, Au Western Europe World LA Africa
Latin American Nations Ranked by Gross Domestic Product(GDP- (PPP)) in 2006 Millions of International Dollars, CIA
Poverty Line (lowest to highest) Source: CIA World Factbook[5
Unemployment Rate (lowest to highest) Source: CIA World Factbook
A key Variable: the Socio-Economic Conditions in Latin America
Latin America USA Income Inequality in Latin America
Central Questions about Latin America • Why Latin America has not improved more rapidly after all? • Why being rich in natural resources yet it is relative poor? • The relationship of the US with Latin America • Is Latin America ready for change, especially for regional free trade (FTAA)? • Is the business environment the same across Latin America?
Business Realities in Latin America the hard way… • Significant differences by country and by region • More than economics, institutional capacity is critical • ..and accountability and transparency • ..and also, the Rule of Law • National cultures vs Corporate cultures • Is NAFTA-Mexico a good example?…well
North American Free Trade Agreement –2006 Results • 2006 Total Value $868 billion • Increase in the last 5 years by 32% • Trade with Canada equals $533 billion, increase by 15% • Trade with Mexico equals $335 billion increase by 60% • Trade with Canada and Mexico accounts for almost 45% of the total U.S. trade • U.S. corporations seeking to export to EU through Mexico • 2005 Security and prosperity agenda (logistics, logistics, and logistics) • Data: U.S. Dept. of Commerce and U.S. Trade Authority Office
Brazil and Mercosur, or how Americas trade is difficult • Brazil control on trade in South America • strong internal fiscal control (conservative members of cabinet) • strong control of currency volatility • strong attraction of foreign direct investment • strong opposition to U.S. subsidies • strong opposition to free trade USA style • Production of ethanol
Argentina Basic Briefing • Population 2008: 41,000,000 • Capital (population): Buenos Aires (12,000,000) • Life expectancy at birth: 76.32, Male: 72.6 Female: 80.24 • Total surface 2,766,891 km²
Where we come from? Rosario: The Center of the Agribusiness Production Area in Argentina Rosario
Argentina’s GDP 1993-2007in constant prices of 1993pesos Hundred of millions of pesos 1993 1995 1998 2000 2002 2004 2005 2007 Year
Arg Vice-Pres resigns X/2000 2004-2007 Recovery Devaluation of the Real I/99 III/2001Finance Secretaries(2) Resign External Credit CutVII/01 XII/01Financial Bolt Argentina’s GDP 1993-2007 in constant prices of 1993 pesos 1989-1990 Hyperinflation 1993 1995 1998 2000 2002 2004 2006
By now (2007) Argentina’s per capita GDP is higher than the pre-crisis level
2005 prices: 27 thousand billions times 1970 The Horror Story: Inflation in Argentina (INDEC)
Inflation in Argentina (INDEC) Pegged currency Recession Devaluation Recovery with increasing inflation pressure
Balance of Non-Financial Public Sector, in Argentina 1995 - 2006 From Deficit to Suplus
Balance of Non-Financial Public Sector, in Argentina 1995 - 2006
Argentina’s Central Bank Reserves 2003-2007 50 000 million U$ dollars 10.000 mill US dollars 2003 2004 2005 2006 2007
Argentina’s Total Foreign Debt 107 Billion USD=55% /ARG GDP MillionsUSD
Infrastructure and Investment: Public and Private Investment 1993-2006 in millions of 1993 pesos
Infrastructure and Investment: Public and Private Investment 1993-2006 in millions of 1993 pesos
Industrialactivity • Industry was growing year by year, after the 2001 crisis
Currency • The last years were characterized by a relative high peso-dollar real exchange rate
Exports • Exports are mostly based on commodities with low value added
Internal environment • Domestic demand feels strong and sustained
Threats • After many years of sustained demand, the industry is close to full capacity • Energy demand is climbing to a maximum, without enough investment to expand the offer
Threats • Domestic energy prices were kept artificially low (electricity, natural gas, gasoline, etc.) creating an adverse scenario for private investment in those areas • Inflation: growing fast, being not recognized by official indexes
Emerging Markets • Emerging markets grew aggressively in 2007
Merval index vs. DJI • Since Argentine domestic markets are mostly driven by food commodities’ prices, there is a good perspective for sustain
+ Strong short term growth Good Fiscal performance Positive foreign trade exchange Foreign debt reduction Higher employment - Still a risky country Potential Inflationary risk Strongly dependent on commodity prices Poverty: 30% of the population has serious problems Weak capital and financial system Low competitiveness in many industries Weak Infrastructure Low foreign Investment Summary of Argentina’s Macro Situation
Business Environment • Since Argentine domestic markets are mostly driven by food commodities’ prices, there is a good perspective for sustained consumption, at least for the next 5 years • If a global recession occurs, Argentina should not have problems due to: • Historical high level of reserves • The Banking sector is totally recovered from the 2001 crisis • The sovereign debt was restructured
Next short-term challenges for companies in Argentina • Inflation pressures: both internal and external • Labor costs: unions do not follow official indexes • Energy costs: will tend to reach international prices In such an environment, companies should be more competitive improving productivity and value added
Population 2005: 175,468,575 Capital (population): Brasilia (1,600,000) Life expectancy at birth: male 58.96 years, female 67.73 years (2001 est.) Physicians per 1000 people: 1.47 Rural/urban population ratio: 21/79 GDP per capita: U $9,100 Brazil Basic Briefing
Foreign investment 1998-1999 first country in the world 2004-2005 third place after Mexico and China Crisis of Confidence Crash of Stocks 3% increase in base rate since October 14 Leading MERCOSUR Brazil Economic development based in central economy
Population 2005: 16,598,074 Capital (population): Santiago de Chile City (6,000,000 metropolitan) Life expectancy at birth: 76.96male 73.69 years, female 80.40 years (2001 est.) Total surface: 756,950 km² Chile Basic Briefing
Chile’s Economic Miracle(chart in terms of GDP per capita) Chile’s per capita GDP Average LA GDP per cap