
Uploaded by
tabib
1 SLIDES
166 VUES
10LIKES
ismej200842x1
DESCRIPTION
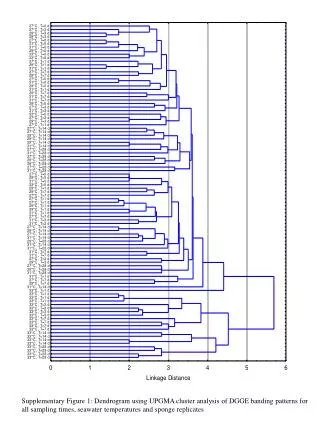
Supplementary Figure 1: Dendrogram using UPGMA cluster analysis of DGGE banding patterns for all sampling times, seawater temperatures and sponge replicates.
Download
1 / 1
Télécharger la présentation 
ismej200842x1
An Image/Link below is provided (as is) to download presentation
Download Policy: Content on the Website is provided to you AS IS for your information and personal use and may not be sold / licensed / shared on other websites without getting consent from its author.
Content is provided to you AS IS for your information and personal use only.
Download presentation by click this link.
While downloading, if for some reason you are not able to download a presentation, the publisher may have deleted the file from their server.
During download, if you can't get a presentation, the file might be deleted by the publisher.
E N D
Presentation Transcript
Supplementary Figure 1: Dendrogram using UPGMA cluster analysis of DGGE banding patterns for all sampling times, seawater temperatures and sponge replicates
More Related
Audio
Live Player