Download
1 / 18
180 likes | 406 Vues
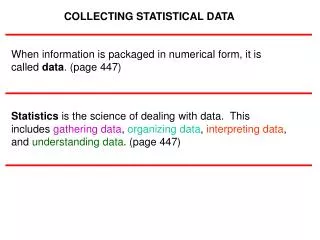
When information is packaged in numerical form, it is called data . (page 447). Statistics is the science of dealing with data. This includes gathering data , organizing data , interpreting data , and understanding data . (page 447). COLLECTING STATISTICAL DATA.

E N D
When information is packaged in numerical form, it is called data. (page 447) Statistics is the science of dealing with data. This includes gathering data, organizing data, interpreting data, and understanding data. (page 447) COLLECTING STATISTICAL DATA
The N-value is an accurate head count of every member of a population. (page 448) Do not confuse the N-value with the population itself. The group of individuals or objects to which a statistical statement refers is called the population. (page 448)
When populations are small and accessible, one can actually get an exact N-value by simply counting “heads”. Census: Collecting data from every member of the population (page 450) Determining the N-Value of a population
Collecting data from a selected subgroup of a population and then using those data to draw a conclusion and make statistical inferences about the entire population is called conducting a survey. The subgroup of the population from which the data is collected is called a sample. (page 452) The N-value N=430 is only an estimate.
THE CAPTURE-RECAPTURE METHOD: ESTIMATING THE N-VALUE OF A POPULATION BY SAMPLING (page 460) STEP 1. The Capture: Capture (choose) a sample of size , tag (mark, identify) the animals (objects, people), and release them back into the general population. STEP 2. The Recapture: After a certain period of time, capture a new sample of size , and take an exact head count of the tagged individuals (i.e., those that were also in the first sample). Let’s call this number k. The ratio is approximately equal to the ratio . From this we get: .
Example. You want to estimate how many fish there are in a small pond. Suppose you capture 500 fish, tag them, and throw them back in the pond. After a couple of days, you go back to the pond and capture 120 fish, of which 30 are tagged. Give an estimate of the N-value of the fish population in the pond.
Page 459 Statisticians use the term statistic to describe any kind of numerical information drawn from a sample. A statistic is always an estimate for some unknown measure, called a parameter, of the population.
Sampling error(page 459) is the difference between a parameter and a statistic used to estimate that parameter.
In surveys, chance error is the result of sampling variability : the fact that two different samples are likely to give two different statistics, even when the samples are chosen using the same sampling method. Sample bias is the result of having a poorly chosen sample. Page 459
If n is the sample size and N is the population size then n/N is called the sampling rate. This is usually expressed as a percentage. A sampling rate of x% indicates that the sample is x% of the population. (page 529) The critical issues are: a. Finding a sample that is representative of the population, and b. Determining how big the sample should be. Choosing a good sample of a reasonable size is more important that the sampling rate.
Consider the M&M example Assume there are 1,500 M&M’s in the container • Describe the population of the survey • Describe the sample for this survey • Give the sample statistic for the number of M&M’s in this survey • Give the parameter of the survey • Give the sampling proportion for the survey • Give the sampling error • Give the sampling error, expressed as a percent • Is the sampling error found a result of sampling variability or sampling bias? Explain.
A public opinion poll (page 453) is a special kind of a survey in which the members of the sample provide information by answering specific questions from an “interviewer”.
Example • In order to estimate how effective Mr. Evans is in his Core 120 class, he gives 5 students in his section a survey on which they rate his/her efficiency on a scale of 1-5. he chooses students from each section in the following way: one that is getting an “A”, one that is getting a “B”, one that is getting a “C”, etc… • The scores reported were 4, 4, 5, 4, 4. • At the end of the semester, he gives the survey to all students in the class and finds that the average rating is 4.45
Describe the population of the survey • Describe the sample for this survey • Give the sample statistic (if it is given) for the average rating of Mr. Evans • Give the parameter (if it is given) for the average rating of Mr. Evans • Give the sampling proportion (rate) for the survey • Give the sampling error • Give the sampling error, expressed as a percent • Is the sampling error found a result of sampling variability or sampling bias? Explain. • What could be done with this sample to eliminate (or minimize) the sampling error.
The critical issues are: a. Finding a sample that is representative of the population, and b. Determining how big the sample should be. A public opinion poll (page 453) is a special kind of a survey in which the members of the sample provide information by answering specific questions from an “interviewer”.
Bush's lead gets smaller in poll • BySusan Page, • USA TODAY WASHINGTON — President Bush leads Sen. John Kerry by 8 percentage points among likely voters, the latest USA TODAY/ CNN/Gallup Poll shows. That is a smaller advantage than the president held in mid-September but shows him maintaining a durable edge in a race that was essentially tied for months. Results based on likely voters are based on the sub sample of 758 survey respondents deemed most likely to vote in the November 2004 General Election. The margin of sampling error is ±4 percentage points.
1936 Literary digest poll • 1936 - Great Depression • Presidential election between Democrat Franklin D. Roosevelt and Republican Alfred Landon. • Literary digest runs a poll before election • Telephone lists, professional organizations, magazine subscriptions • Created a list of 10,000 names • From 2.4 million respondents: • Landon 57% • Roosevelt 43% • Actual results • Landon 38% • Roosevelt 62%
Homework • Read pages 452 - 461 • Page 467: 1 – 16, 29 – 34, 37, 38, 59