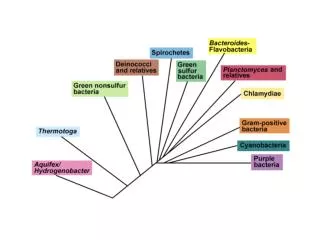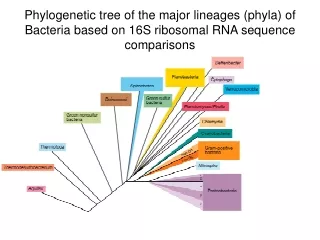
Proteobacteria
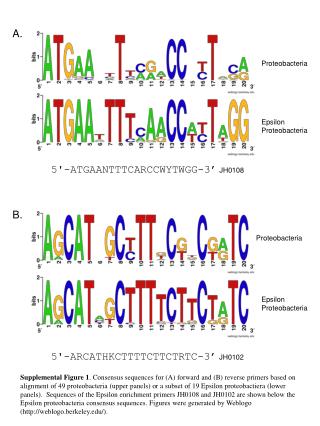
A. Proteobacteria. Epsilon Proteobacteria. 5'-ATGAANTTTCARCCWYTWGG-3’ JH0108. B. Proteobacteria. Epsilon Proteobacteria. 5'-ARCATHKCTTTTCTTCTRTC-3’ JH0102.

Proteobacteria
E N D
Presentation Transcript
A. Proteobacteria Epsilon Proteobacteria 5'-ATGAANTTTCARCCWYTWGG-3’JH0108 B. Proteobacteria Epsilon Proteobacteria 5'-ARCATHKCTTTTCTTCTRTC-3’JH0102 Supplemental Figure 1. Consensus sequences for (A) forward and (B) reverse primers based on alignment of 49 proteobacteria (upper panels) or a subset of 19 Epsilon proteobactiera (lower panels). Sequences of the Epsilon enrichment primers JH0108 and JH0102 are shown below the Epsilon proteobacteria consensus sequences. Figures were generated by Weblogo (http://weblogo.berkeley.edu/).
Campylobacter jejuni (ε) Campylobacter fetus (ε) Helicobacter sp. (ε) Salmonella (γ) Pasteurella (γ) Pseudomonas (γ) Bartonella (α) Supplemental Figure 2. Temperature gradient PCR with Epsilon-proteobacteria enrichment primers on pure proteobacteria cultures. PCR primers JH0108 and JH0102 were tested with genomic DNA extracts in a gradient PCR with annealing temperatures from 49.3°C to 60.1°C (indicated by increasing triangle), plus no template control (-). Arrows indicate the 1200 bp marker . The cpn10-cpn60 target of ~1200 bp was clearly seen with epsilon-proteobacteria genomic DNA (C. jejuni, C. fetus and Helicobacter sp.), while only non-specific bands were obtained from gamma- and alpha-proteobacteria genomic DNA (Salmonella, Pasteurella, Pseudomonas and Bartonella samples).
Supplemental Figure 3. Rarefaction curves of dog fecal microbiota libraries generated in this study. Both rarefaction analysis and the Good’s coverage estimate (given in parentheses after each library) were calculated using mothur software.
Supplemental figure 3 (continued). Rarefaction curves of dog fecal microbiota libraries generated in this study. Both rarefaction analysis and the Good’s coverage estimate (given in parentheses after each library) were calculated using mothur software.
100 HDS1fall 61 HDS2fall 49 HDS2spring 100 DDS18 100 HDS8 100 HDS1spring HDS18D 100 HDS30 84 DDS2 100 100 DDS64 70 DDS34 87 HDS19 43 70 DDS19 87 DDS32 DDS30 HDS9A 100 DDS11 DDS51 0.1 Supplemental Figure 4A. A jackknifed clustering of the samples by Unifrac distances (100 permutations) of non-enriched libraries. The numbers at the nodes indicate the number of times that particular node was observed (out of 100) in a random sampling of the dataset. Brackets highlight the distinction between the cluster that is predominantly healthy dog libraries and the cluster that is predominantly diarrheic dog libraries.
100 100 100 HDS19.enrich 98 HDS1fall.enrich.rep 97 HDS1fall.enrich 97 DDS19.enrich DDS30.enrich 97 85 HDS2fall.enrich 100 HDS2spring.enrich 100 HDS18D.enrich HDS1spring.enrich 100 HDS8.enrich 98 65 HDS9A.enrich 100 DDS51.enrich 71 HDS30.enrich DDS34.enrich 100 97 DDS2.enrich 97 DDS32.enrich DDS64.enrich DDS18.enrich 100 62 HDS9A.universal 48 HDS1fall.universal 99 HDS2fall.universal 100 HDS2spring.universal 100 DDS18.universal HDS8.universal 100 42 HDS1spring.universal HDS18D.universal 67 HDS30.universal DDS19.universal 100 100 DDS32.universal 72 67 DDS2.universal DDS64.universal 36 100 DDS34.universal 100 HDS19.universal 34 DDS11.universal DDS51.universal DDS11.enrich DDS30.universal 0.1 Supplemental Figure 4B. A jackknifed clustering of the samples by Unifrac distances (100 permutations) of all libraries generated in the study. The numbers at the nodes indicate the number of times that particular node was observed (out of 100) in a random sampling of the dataset. Brackets highlight the distinction between the cluster that is predominantly universal (non-enriched) cpn60 libraries and the cluster that is predominantly epsilon-proteobacteria enriched libraries.
A B Supplemental Figure 5. Comparison of technical replicates of HDS1fall at the (A) phylum and (B) genus level.
Supplemental Figure 6. Phylogenetic tree of epsilon-proteobacteria OTU. A 100 bp region (from nucleotide 200-300 within the cpn60 UT region) was aligned and used to generate a neighbour-joined tree. Alignments were manually inspected to identify any anomolous sequences that incorrectly passed quality control (none were identified). Species are highlighted by coloured backgrounds. Isotigs (equivelant to OTU) that represent possible novel species have been highlighted with the label “(possible novel X species)”. 126 isotigs (possible novel Helicobacter sp.) isotig 232 isotig 536 H. cinaedi H. hepaticus 22 isotigs isotig 164 isotig 646 H. canis H. mustelae H. acinonychis isotig 864 H. nemestrinae H. pylori H. bizzozeronii H. salomonis H. felis H. fennelliae H. cholecystus H. pametensis H. winghamensis H. muridarum H. pullorum H. bilis isotig 887 (Flexispirarappini OTU) H. trogontum H. canadensis A. skirrowii isotig 731 isotig 883 A. nitrofigilis A. mytili C. sputorum C. hyointestinalis 12 isotigs isotig 905 C. upsaliensis isotig 027 C. helveticus C. coli C. jejuni C. lari C. fetus fetus C. fetus venerealis isotig 579 isotig 585 isotig 632 (possible novel Campylobacter species) C. gracilis C. mucosalis C. concisus isotig 594 C. retus C. showae C. curvus E. coli 0.1