Download
1 / 19
190 likes | 341 Vues
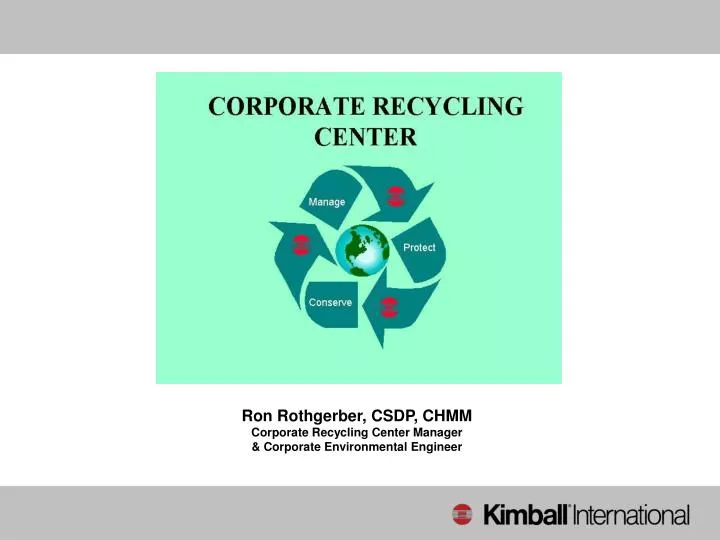
Ron Rothgerber, CSDP, CHMM Corporate Recycling Center Manager & Corporate Environmental Engineer. Waste Aversion. 3-R’s – Reduce, Re-Use, Recycle (Now evolving to the 4-R’s starting with “Refuse”) Recycling has always been a part of the Process

E N D
Ron Rothgerber, CSDP, CHMM Corporate Recycling Center Manager & Corporate Environmental Engineer
Waste Aversion • 3-R’s – Reduce, Re-Use, Recycle (Now evolving to the 4-R’s starting with “Refuse”) • Recycling has always been a part of the Process • Began Tracking Solid Waste and Re-Use/ Recycling Efforts in 1996
Why a Central Location? • Floor Space at Production Facilities • Aggregation Capability • Truckload Pricing vs Mixed/Partial Loads • Control Liabilities • Reduce Landfill Costs
Waste Statistics • 81,369 tons of Waste Generated in 1996 Corporate-Wide
Waste Statistics • 81,369 tons of Waste Generated in 1996 Corporate-Wide • 15,713 tons of Waste Generated in 2009 Corporate-Wide
Waste Statistics • 81,369 tons of Waste Generated in 1996 Corporate-Wide • 15,713 tons of Waste Generated in 2009 Corporate-Wide • 80.7% Reduction in Waste Generated from all global facilities from 1996-2009
Waste Statistics • In 1996, 16,226 tons were sent to the landfill
Waste Statistics • In 1996, 16,226 tons were sent to the landfill • In 2009, Only 2,022 tons were sent to the landfill
Waste Statistics • In 1996, 16,226 tons were sent to the landfill • In 2009, Only 2,022 tons were sent to the landfill • 87.5% Reduction in Landfilled Materials
Waste Statistics • Landfill Costs in 1996 = $615,268
Waste Statistics • Landfill Costs in 1996 = $615,268 • Landfill Costs in 2009 = $304,639
Waste Statistics • Landfill Costs in 1996 = $615,268 • Landfill Costs in 2009 = $304,639 • 50.5% Overall Reduction in Costs, however, a 397.3% increase in cost/ton ($37.92/ton – 1996 to $150.66/ton – 2009)
Waste Statistics • In 2009, 87.1% of all Waste Generated was Recycled or Re-Used • If Waste Disposal tonnages had remained at 1996 levels the Landfill Cost would be over $2.44 Million.
Corporate Recycling Center • Operates as a Break-Even Profit Center • Operation has only 2 Full-Time Employees • 28.5 Million Pounds of Materials Processed, Recycled, or Re-Used through the CRC since November 2002 • 2009 Waste Landfill Cost Avoidance = $380,870
Corporate Recycling Center • Continuation of Existing Recycling Efforts • Basic Materials Recycling: Cardboard, Steel, Aluminum, Paper • Expansion of New Recycling and Re-Use Efforts • Currently recycling approx. 65 different items • Redistribute usable equipment and supplies – intercompany • Sale of usable equipment and supplies - externally • Provide Recycling Resource where otherwise unavailable or non-feasible • Cost Aversion from Landfill Fees • Increase Security and Reduce Liability
Corporate Recycling Center • Some of the Materials Recycled include: