Download
1 / 16
160 likes | 382 Vues
NEAR INFRA RED and Thermal Radiation Dr. M. M. Yagoub Dep. Of Geography, UAEU E-mail: myagoub@uaeu.ac.ae E-mail: myagoub@hotmail.com URL: http://www.angelfire.com/mo/yagoub. Overview . NEAR INFRA RED (NIR) NEAR INFRA RED Applications

E N D
NEAR INFRA RED and Thermal Radiation Dr. M. M. Yagoub Dep. Of Geography, UAEU E-mail: myagoub@uaeu.ac.ae E-mail: myagoub@hotmail.com URL: http://www.angelfire.com/mo/yagoub
Overview • NEAR INFRA RED (NIR) • NEAR INFRA RED Applications • THERMAL INFRA RED (TIR) • Temperature • Emissivity • Thermal Energy Detectors (Radiometer) • Thermal infrared (TIR) Applications • Factors affect Thermal imagery
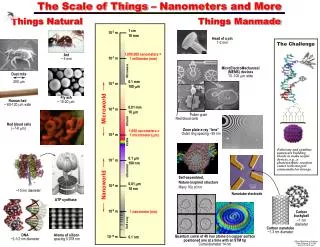
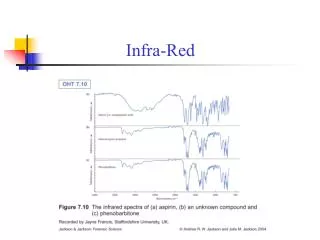
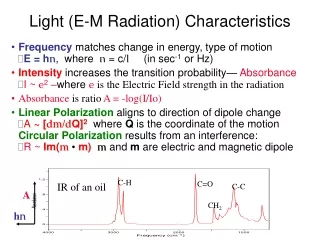
NEAR INFRA RED (NIR) • Infrared (0.7-1000 ) - emitted thermal radiation (temperature of objects) • The NEAR INFRA RED portion of the Electromagnetic Spectrum occurs in the 0.7 µm to 1.3µm region. NIR is within the reflective portion of the spectrum and can be recorded photographically, using special false colour photographic films. • Conventional photographic emulsions and CCD arrays will typically not able to detect reflected or radiated electromagnetic energy beyond near infra red. A specially designed thermal sensor or radiometer is required to sense energy in the mid IR and thermal bands. • By definition: • Mid InfraRed 1.3 um to 3.0 um - Reflective portion • Thermal IR 3.0um to 14 um - Emissive portion • While typically in the reflected portion of the spectrum MID IR imagery is influenced by high energy thermal emissions. Typically these are very hot features such as lava flows or intense bush fires with temperatures in the 400K - 1000K range (100C plus range. refer to blackbody diagram • Typically in this portion vegetation effects are less than that of Infra red while geological features (rocks & soils still maintain a high response).
Geological features (rocks & soils ) maintain a high response in Near Infrared
NEAR INFRA RED Applications • Near Infra Red imagery offers a useful means for soil analysis, agricultural studies, vegetation (BIOMASS) studies and for land/water delineation. Visible bands are ideal for cartographic and general land use interpretation. While photography enables detailed studies, satellite imagery enables multi-spectral studies over larger areas • To date mid infra red is limited to Landsat and SPOT 4 [ where 20 metre spatial resolution mid Infrared band 1.58 - 1.75 um] • Typical applications of the Landsat bands 5 & 7 include:. • Band 5 (1.55um - 1.75um): indicative of vegetation moisture content and soil moisture, differentiation of snow from clouds. • Band 7 (2.08um - 2.35um):discrimination of rock types. Sensitive to vegetation moisture content and soil moisture content.
Note about NIR • Near Infra Red typically measures EM response of reflected energy. However for particularly hot features such as lava, intense bushfires etc. Near Infra red does become sensitive to emitted energy • Near Infra red should not be confused with Thermal Infra red • Vegetation appears RED in NIR composites only because the NIR response is much greater than that of the visible bands. Thus vegetation would still be measured as ‘green’ in the visible portion. If we assign NIR a green colour then it will similarly appear green => ie. NIR response for vegetation is HIGH
THERMAL INFRA RED (TIR) • Thermal infra red is the sensing of emissive energy or "temperature" energy • It is governed by various laws and concepts including; Blackbody concept, Stefan-Boltzmann Law, Wiens Law, and Kirchof's Law • For satellite remote sensing purposes Thermal IR applications are typically limited to two distinct portions due to atmospheric interference, the two portions include; • 3 to 5 um range and 8 to 13 um range
Temperature • The sun is the most obvious source of EM radiation for remote sensing. However all matter at temperatures above absolute zero (00K or -2730C) continuously emits EM radiation. • The amount of energy emitted by an object is directly proportional to its temperature. This property is expressed mathematically as the Stefan-Boltzmann Law • The point to note is that radiation increases with temperature(a very high exponential increase) i.e. hotter objects emit more energy • A blackbody is a hypothetical, ideal radiator that totally absorbs and re-emits all energy incident upon it
Spectral distribution of energy radiated from blackbodies of various temperatures
Emissivity • Real materials such as rocks, water, soil, road pavements do not behave as perfect black or grey bodies. They emit only a fraction of the energy emitted by a black body. This emitting ability of a material is called emissivity (e) and is a dimensionless scaling ratio • Heat can be transferred in 3 ways convection, conduction, radiation • In remote sensing we measure radiation using a radiometer. • Other important thermal properties include; • thermal conductivity - rate at which heat will pass through a material • thermal capacity - ability of material to store heat (absorbed energy) • thermal diffusivity - rate at which temperature can change within a body (energy loss / gain characteristics ) • thermal inertia - thermal response, delay in reaching ambient temperature following exposure to energy • During the day when surface-atmosphere exchange is high there is the likelihood that air temperature will affect the energy sensed • A major consideration in thermal interpretation is the temporal variation (time - hourly, daily, seasonal) in response of features. Of significant interest is the diurnal response of features and thermal inertia. • Thermal Inertia : Comparison of Water and Vegetation :During the day water bodies have a relatively cooler surface temperature than soils and rocks
Thermal Energy Detectors • There is a wide range of thermal detectors available The simplest systems are video based and have been used successfully in low cost remote sensing systems • Typically low temperature systems require cooling (usually liquid nitrogen) • Common Satellite Sensors in Thermal IR include: • Landsat Band 6 (10.4-12.5um) • NOAA AVHRR Band 4 (3.55-3.93 um) (TIR) • Large number of meteorological and ocean monitoring satellites with resolutions around 2km-5km -10km including GOES, GMS, MOS 1, SeaWiFs, Nimbus CZCS (1 thermal), SeaSat, HCMM
Thermal infrared (TIR) Applications • Thermal infrared (TIR) images of the Earth's surface can provide accurate distributions of surface spectral emittance and temperature (at local to global scales) • Heat and moisture fluxes (exchanges) • Climatological processes • Evapo-transpiration • Soil moisture variation • Hydrology, oceanography and ocean currents • Biomass distribution • Vegetation monitoring • Lithology & geology • Urban land use • Natural disaster monitoring (volcano) • Thermal pollution
Factors affect Thermal imagery • The high level of spectral sensitivity required • The optimum times for thermal sensing are at night • cloud shadowing - temperature in cloud shadow is often slightly lower than ambient, can result in false interpretation. • slope aspect - orientation and facing direction of slope • sun angle and diurnal temperature due to local weather conditions and seasonal variation
References • Campbell, J. B. , 1996. Introduction to Remote Sensing. 2nd ed.,Taylor and Francis, London. • Lillesand,T. M. and R. W. Kiefer, 2000. Remote Sensing and Image Interpretation. 4thed., John Wiley and Sons, Inc., New York.