Download
1 / 37
370 likes | 693 Vues
Modeling the Ebola Outbreak in West Africa, 2014. Sept 16 th Update Bryan Lewis PhD, MPH ( blewis@vbi.vt.edu ) Caitlin Rivers MPH, Eric Lofgren PhD, James Schlitt , Katie Dunphy , Henning Mortveit PhD, Dawen Xie MS, Samarth Swarup PhD, Hannah Chungbaek ,

E N D
Modeling the Ebola Outbreak in West Africa, 2014 Sept 16th Update Bryan Lewis PhD, MPH (blewis@vbi.vt.edu) Caitlin Rivers MPH, Eric Lofgren PhD, James Schlitt, Katie Dunphy, Henning Mortveit PhD, DawenXie MS, Samarth Swarup PhD, Hannah Chungbaek, Keith Bisset PhD, Maleq Khan PhD, Chris Kuhlman PhD, Stephen Eubank PhD, MadhavMarathe PhD, and Chris Barrett PhD
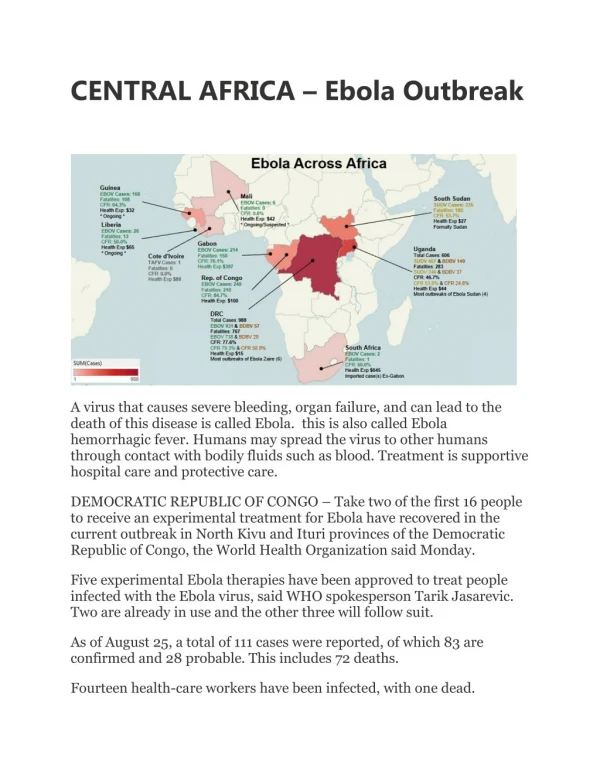
Currently Used Data Cases Deaths Guinea 861 557 Liberia 24071137 Nigeria 22 8 Sierra Leone 1603 524 Total 4893 2226 • Data from WHO, MoH Liberia, and MoH Sierra Leone, available at https://github.com/cmrivers/ebola • Sierra Leone case counts censored up to 4/30/14. • Time series was filled in with missing dates, and case counts were interpolated.
Sierra Leone – Case Finding Assuming all cases are followed to the same degree, this what the “observed” Re would be based on cases found from contacts (using time lagged 7,10,12 day reported cases as denominator)
Line Listing case_idexposure_dateonset_datehospital_datedeath_daterecovery_date age sex country sub_locationsub_sub_locationlegrand exposure hcwsource_ididentifying_notesource 1 2013-12-02 2013-12-06 child Guinea GueckedouMeliandou c zoonotic N http://www.nejm.org/doi/full/10.1056/NEJMoa1404505 2 2013-12-13 adult F Guinea GueckedouMeliandou c family N 1 mother http://www.nejm.org/doi/full/10.1056/NEJMoa1404506 3 2013-12-25 2013-12-27 child F Guinea GueckedouMeliandou c family N 1 sister http://www.nejm.org/doi/full/10.1056/NEJMoa1404507 4 2014-01-01 elderly F Guinea Gueckedou c family Y 1 grandmother http://www.nejm.org/doi/full/10.1056/NEJMoa1404508 5 2014-01-29 2014-01-31 adult F GuineaGueckedou h hcw Y 1 nurse http://www.nejm.org/doi/full/10.1056/NEJMoa1404509 6 2014-01-25 2014-02-02 adult F GuineaGueckedou h hcw Y 1 midwife http://www.nejm.org/doi/full/10.1056/NEJMoa1404510 • Gathered 50 case descriptions from media reports • Tried to piece together all info we’d like access to from “comprehensive source” case_id,exposure_date,onset_date,hospital_date,death_date,recovery_date,age,sex,country,sub_location,sub_sub_location,legrand,exposure,hcw,source_id,identifying_notes,source
Twitter Tracking Most common images: Information about bushmeat, info about case locations, joke about soap cost, and dealing with Ebola patients,
Liberia Forecasts Forecast performance Reproductive Number Community 1.34 Hospital 0.35 Funeral0.53 Overall 2.22 52% of Infected are hospitalized
Sierra Leone Forecasts Forecast performance Reproductive Number Community1.22 Hospital 0.23 Funeral 0.24 Overall 1.69 59% of cases are hospitalized
All Countries Forecasts Model Parameters 'alpha':1/10 'beta_I':0.200121 'beta_H':0.029890 'beta_F':0.1 'gamma_h':0.330062 'gamma_d':0.043827 gamma_I':0.05 'gamma_f':0.25 'delta_1':.55 'delta_2':.55 'dx':0.6 rI:0.85 rH:0.74 rF:0.31 Overal:1.90
Synthetic Sierra Leone Now integrated into the ISIS interface
Next Steps - Compartmental • Interventions under way • More hospital beds in urban areas • More “home-care” kits in rural areas • Arrival of therapeutics • Inform the agent-based model • Geographic disaggregation • Parameter estimation • Intervention comparison
Next Steps – Agent-based • Implement new disease mapping • Has been • Add regional mobility • ABM stochastic space larger than compartmental, how to accommodate? • Integrating data to assist in logistical questions • Locations of ETCs, lab facilities from OCHA • Road network • Capacities of existing support operations
Supporting material describing model structure, and additional results Appendix
Further evidence of endemic Ebola • 1985 manuscript finds ~13% sero-prevalence of Ebola in remote Liberia • Paired control study: Half from epilepsy patients and half from healthy volunteers • Geographic and social group sub-analysis shows all affected ~equally
Legrand et al. Model Description Legrand, J, R F Grais, P Y Boelle, A J Valleron, and A Flahault. “Understanding the Dynamics of Ebola Epidemics” Epidemiology and Infection 135 (4). 2007. Cambridge University Press: 610–21. doi:10.1017/S0950268806007217.
Compartmental Model • Extension of model proposed by Legrand et al. Legrand, J, R F Grais, P Y Boelle, A J Valleron, and A Flahault. “Understanding the Dynamics of Ebola Epidemics” Epidemiology and Infection 135 (4). 2007. Cambridge University Press: 610–21. doi:10.1017/S0950268806007217.
Legrand et al. Approach • Behavioral changes to reduce transmissibilities at specified days • Stochastic implementation fit to two historical outbreaks • Kikwit, DRC, 1995 • Gulu, Uganda, 2000 • Finds two different “types” of outbreaks • Community vs. Funeral driven outbreaks
NDSSL Extensions to Legrand Model • Multiple stages of behavioral change possible during this prolonged outbreak • Optimization of fit through automated method • Experiment: • Explore “degree” of fit using the two different outbreak types for each country in current outbreak
Optimized Fit Process • Parameters to explored selected • Diag_rate, beta_I, beta_H, beta_F, gamma_I, gamma_D, gamma_F, gamma_H • Initial values based on two historical outbreak • Optimization routine • Runs model with various permutations of parameters • Output compared to observed case count • Algorithm chooses combinations that minimize the difference between observed case counts and model outputs, selects “best” one
Fitted Model Caveats • Assumptions: • Behavioral changes effect each transmission route similarly • Mixing occurs differently for each of the three compartments but uniformly within • These models are likely “overfitted” • Many combos of parameters will fit the same curve • Guided by knowledge of the outbreak and additional data sources to keep parameters plausible • Structure of the model is supported
Long-term Operational Estimates • Based on forced bend through extreme reduction in transmission coefficients, no evidence to support bends at these points • Long term projections are unstable