Download
1 / 25
250 likes | 398 Vues
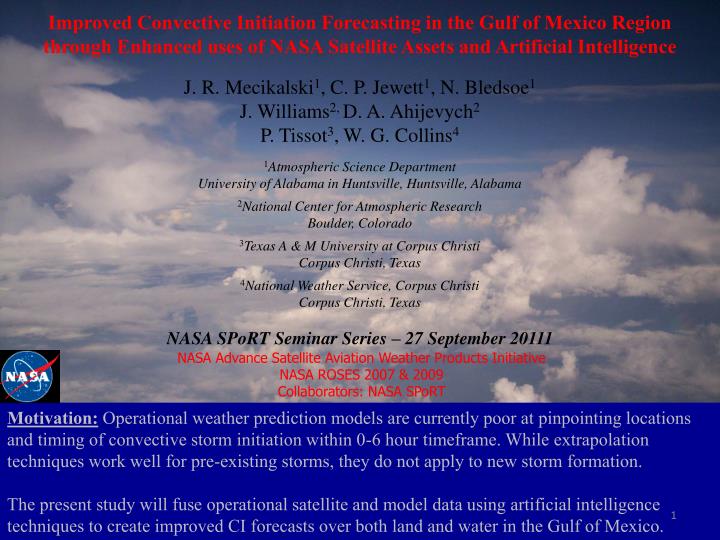
Improved Convective Initiation Forecasting in the Gulf of Mexico Region through Enhanced uses of NASA Satellite Assets and Artificial Intelligence J. R. Mecikalski 1 , C. P. Jewett 1 , N. Bledsoe 1 J. Williams 2, D. A. Ahijevych 2 P. Tissot 3 , W. G. Collins 4

E N D
Improved Convective Initiation Forecasting in the Gulf of Mexico Region through Enhanced uses of NASA Satellite Assets and Artificial Intelligence J. R. Mecikalski1, C. P. Jewett1, N. Bledsoe1 J. Williams2, D. A. Ahijevych2 P. Tissot3, W. G. Collins4 1Atmospheric Science Department University of Alabama in Huntsville, Huntsville, Alabama 2National Center for Atmospheric Research Boulder, Colorado 3Texas A & M University at Corpus Christi Corpus Christi, Texas 4National Weather Service, Corpus Christi Corpus Christi, Texas NASA SPoRT Seminar Series – 27 September 20111 NASA Advance Satellite Aviation Weather Products Initiative NASA ROSES 2007 & 2009 Collaborators: NASA SPoRT Motivation: Operational weather prediction models are currently poor at pinpointing locations and timing of convective storm initiation within 0-6 hour timeframe. While extrapolation techniques work well for pre-existing storms, they do not apply to new storm formation. The present study will fuse operational satellite and model data using artificial intelligence techniques to create improved CI forecasts over both land and water in the Gulf of Mexico.
Background & Goals • MODIS datasets will be used to form land surface heating gradient and land surface variability (i.e. heterogeneity) which have been correlated with the formation of non-classical mesoscale circulations that support cumulus cloud development, and therefore help identify potential locations for thunderstorm formation within 1-6 hour timeframes. • Artificial Intelligence techniques will be employed to identify new data for incorporation into the SATellite Convection AnalySis and Tracking (SATCAST) convective initiation algorithm, to optimize SATCAST and to create a probabilistic predictive model of early storm development, 0-1, 1-6 and 24 hours into the future. • Use of the Thunderstorm Artificial Neural Network (TANN) algorithm, including the NASA datasets, in addition to NASA Land Information System (LIS) fields and perhaps AMSR-E sea surface temperatures, will improve 1-6 hour thunderstorm forecasts in the vicinity of southern Texas. • Emphasis is on enhancing convective nowcasting accuracy for Gulf of Mexico region airports. • TRMM, CloudSat and GOES-based CI training database used to characterize storms to define “truth” for tuning and verification.
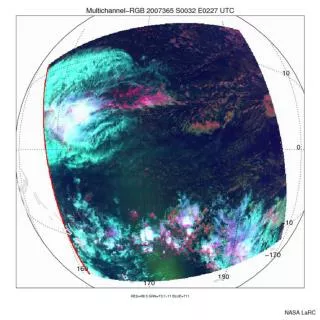
Cloud top heights derived from GOES-East via the NASA-funded Convective Diagnosis Oceanic product show the path of Continental Airlines 128 on August 3, 2009. The aircraft track is overlaid, and an arrow points to the location of the Boeing 767’s convectively induced turbulence encounter above a rapidly-growing convective cell at approximately 0756 UTC. The images are from 0715 (upper left), 0745 (upper right), 0815 (lower left), and 0845 (lower right).
Outline • 1. Algorithms for 0-6 hour CI nowcasting • Random Forest methods, relevant to convective nowcasting • The Artificial Neural Network (ANN) Thunderstorm forecasting model • GOES 0-1 hour convective and lightning initiation nowcasting • Enhancements to RF and TANN • Heating indices/NCMC and 1-6 hour thunderstorm forecasting • Land Surface Variability fields • Development of CI training database (contingency table) • Leveraging ROSES 2007 results
Methods:Convective Nowcasts/Diagnoses SATellite Convection AnalySis and Tracking (SATCAST) System Monitor… ~11 IR fields for GOES: correct negatives CI Time: 1st ≥35 dBZ echo at ground, or at –10 ºC altitude 1746 UTC 1732 UTC miss miss Walker et al. (2011) Mobile Radar at 1826 Tallahassee at 1829
SATCAST Algorithm: Lightning Initiation Interest Fields NASA North Alabama total-cloud, Lightning Mapping Array network, used to identify first flash(above) All 10 lightning initiation interest fields as available from current GOES-12 imagery (right) Harris, R. J., J. R. Mecikalski, W. M. MacKenzie, Jr., P. A. Durkee, and K. E. Nielsen, 2010: Definition of GOES infrared fields of interest associated with lightning initiation. J. Appl. Meteor. Climatol. 49, 2527-2543.
Random Forest (RF) Data Mining • RF is a non-linear data mining technique used to analyze a retrospective database and… • Produce estimates of variable importance • Create a non-parametric (no assumptions about functional form), probabilistic empirical predictive model via an ensemble of decision trees (all combinations of all variables) • Identify the most valuable SATCAST components and additional variables for convective initiation prediction • Method can be used for any problem where a potential predictor values are paired with a binary (yes/no) predictand Data pt. Data pt. Data pt. Data pt. Data pt. Tree 2 Tree 3 Tree 1 Tree 4 Tree 100 … Vote: 0 Vote: 0 Vote: 1 Vote: 1 Vote: 0 => 40 votes for “0”, 60 votes for “1” can be translated into a probability
RF Methodology • Define VIP1 initiation as the observation of VIP1+ at least 40 km away from where any VIP1+ was at the analysis time, adjusted for storm motion • VIP 1+ is equivalent to VIL > 0.14 kg m-2 • Define VIP3 initiation as the observation of VIP3+ at least 40 km away from where any VIP3+ was at the analysis time, adjusted for storm motion • VIP 3+ is equivalent to VIL > 3.5 kg m-2 • Associating potential predictor variables with initiation “truth” at each pixel (adjusted for storm motion) permits statistical analysis of variable significance and construction of a predictive model • For each problem, randomly resample sets of “true” and “false” pixels from dataset (sample more of rare event) • Even Julian days used for training, odd for testing and vice-versa • Multiple training/testing subsets used for cross-validation
Day/night, 159 total predictors Importance Ranks more importantless important Importance Rank SATCAST Near-storm VIP3+ CI VIP3+
Daytime only , 191 total predictors SATCAST Importance Ranks Near-storm regime VIP3+ Near-storm regime VIP1+ CI regime VIP3+ CI regime VIP1+
RF Evaluation on 2009 data CI regime: VIP Level 3+ (daytime only) CSI = Critical Success Index TSS = True Skill Score AUC = Area Under the Receiver Operating Characteristic Curve
Example: RF probabilistic nowcast VIP 3+, 2 hr forecast; only probabilities > 10% shown
ANN Model to forecast thunderstorm activity up to 24 hours in advance, and with a spatial accuracy of 20-km in South Texas • ANN inputs include outputs from • deterministic mesoscale Numerical Weather Prediction (NWP) models, • selected sub-grid scale data that contributes to convective initiation, or CI. • Waylon Collins, Corpus Christi Weather Forecast Office • Philippe Tissot, Texas A&M University-Corpus Christi MODIS
Victoria 07-08 Test Case (Box 238)TANN Input Variables • 1: Date Values (yearly trig curve) • 2-17: F00 NAM Current AtmState • 2-u_sfc[m/s],3-v_sfc,4-u_900,5-v_900,6-u_800,7-v_800,8-u_700,9-v_700,10-u_600,11-v_600,12-u_500,13-v_500,14-shear sfc-700 [x10-3 s-1],15-shear 900-700, 16-HI_Low [C],17-CTP_proxy[dimensionless] • 18-36: F03F18 NAM Predictions: • 18-cp[kg/m^2],19-vv_925[Pa/s],20-vv_700,21-vv_500,22-u_sfc[m/s],23-v_sfc,24-u_850,25-v_850,26-s-8 shear[x10-3 s-1],27-8-6 shear[x10-3 s-1],28-t_sfc[K],29-pw[kg/m^2],30-li[K],31-cape[J/kg], 32-cin,33-dropoff[K],34-rh_850[%],35-mr_850[g/kg],36-LCL[m] • 37: AOD • 38: Ndry (number of previous dry days over the past 10 days) • 39: MaxGradientAPI • 40: Mean API • 41: Max API • 42: MeanBoxAPIGradient • 43: Centroid Distance • 44: Entropy • 45: Purity • 46: Random parameter (for RF – no impact on ANN)
TANN Model Performance • Model calibrated over March 2004 through December 2010 without the period 2007-2008 used for performance assessment (below)
1-6 h CI Nowcasting:Land-surface Heating Partitioning, Soil Moisture, Antecedent Rain Goal: To demonstrate if one can predict today’s convective initiation based on knowledge of “background” information, from the land surface (and the resultant heterogeneity in latent and sensible heating rates) and from antecedent precipitation. 1-6 hour CI Index Inputs: (a) GOES-estimated solar insolation, (b) soil moisture (from models and/or estimated from antecedent rain) and (c) vegetation (health, NDVI). Walker et al. (2009)
Land Surface Variability (LSV) Convective Clouds vs LSV 15-19 UTC 6-14 July 2006 Topography- gradient signal Higher cumulus cloud frequency with increased LSV 7-day average MB06 CI scores: Red= score ≥ 5 CI Scores correlated with topography, vegetation, & land-cover: Physical forcing for cumulus updrafts. Gambill and Mecikalski (2011)
Leveraging ROSES 2007 Results:Enhancements to SATCAST Interest Fields • Precipitable Water (PW) has shown to have most impact on interest fields. Viewing angle is another important impact on the interest fields. • High amounts of PW can cause some interest fields that use 10.7 μm to miss due to water vapor absorption in that channel. • Regional adjustments to IR interest fields help avoid use of uniform thresholds. • Solid determination that use of multiple interest fields is beneficial to reduce false detection, while some IR fields are unimportant in CI nowcasting. • Correlating IR fields to NWP datasets is difficult when expecting to bound CI nowcasting by environmental constraints.
Near-term Plans • Develop a case study approach, focusing on events of CI and LI over Gulf of Mexico and near-shore airports. • Couple 1-6 hour CI nowcasting to “storm intensity” estimates that leverage TRMM cell • database, TRMM fields and LIS. • Populate the ANN model with • MODIS estimates of soil moisture, • and AMSR-E SST data, for 24 hr • thunderstorm forecasting. • Basic research to better understand • how to use IR and reflectance fields • over oceanic regions to nowcast CI. from Donovan et al. (2008) 31
Convective Storm Forecasting 1-6 Hours Prior to Initiation John Mecikalski and John Walker, Univ. Alabama-Huntsville, Huntsville, AL Dan Lindsey and Louie Grasso NOAA/NESDIS/STAR/RAMMB and CIRA, Fort Collins, CO Chris Velden and Steve Wanzong, CIMSS, Madison, WI Bob Rabin, NSSL, Norman, OK Brian Vant-Hull, CREST, New York, NY Project Motivation and Goal One of the greatest difficulties in severe storm forecasting is deciding where and when storms will initially form. Current numerical models struggle with this problem and often have large errors in their 1-6-hour forecasts for convective initiation (CI). The overall goal of this proposal is to develop a single objective system that predicts where and when storms will form 1-6 hours prior to initiation. Institutional Plans CIRA: Utilize the split window difference (10.35–12.3 µm) to identify regions of enhanced or deepening low-level water vapor to help predict where and when convective clouds will form CIMSS: Produce Mesoscale Atmospheric Motion Vectors matching ABI temporal resolution and calculate fields of convergence, divergence, vorticity, and shear UAH: Heating Index and Land Surface Variability indices, and their associated gradients, will be examined for their utility to predict CI on “synoptically calm” days NSSL: Wind observations from the WSR-88D network using the Variational Doppler Radar Analysis System(VDRAS) will be used to provide a more complete picture of the pre-storm wind and moisture fields. CREST: To assist with algorithm validation, radar echoes and National Lightning Detection Network data will be used to catalogue when CI occurs, and the WDSII Segmotion algorithm, along with satellite and model winds, will be used to back-track clouds into the cloud free regions.
Atmospheric Winds, Convergence Low Level Water Vapor Evaluation Cloud level winds x x Cloud-50 mb winds x x x x x t-3 hr x Cloud-100 mb winds t-2 hr t-1 hr CI t = 0 t-4 hr t-5 hr Synthetic split window difference observations from 20 April 2011. Note that the east-west maximum in central Texas is a precursor to convective clouds and eventually convective initiation there. • Back trajectories in clouds will be followed from initiation of severe weather based on IR satellite using WDSSII segmotion algorithm. • When clouds disappear, clear-air trajectories will be followed back to initiation - 6 hours using NWP analysis winds at several different levels below the one that best matches the cloud trajectory. • Maps to be created of time to initiation for each location. t-6 hr • ABI top of atmosphere radiances have been generated for May 21, 1700 UTC to May 21, 2015 UTC. • The GOES-R AWG Winds Algorithm isn’t significantly impacted by using the “quick” forward model to generate visible reflectances. Project Components… Differential Surface Heating Land-Surface Variability (LSV) is a means of evaluating locations where elevation gradients, land cover type, and gradients in NDVI, can enhance the occurrence of convective cloud development. Antecedent rainfall is used to estimate how heating is partitioned between latent and sensible. Project Challenge The formation of an automated probabilistic system that predicts CI 1-6 hours in advance. To produce a continuous forecast in space and time, one approach is to use NWP CI forecasts as a first guess, then modify it from information gleaned from these satellite techniques. Sensible heating gradients are formed once incoming net radiation is known (from GOES), and hence locations where differential heating may lead to the formation of non-classical meso-scale circulations, and hence regions where CI is more favored in 1-6 h timeframes
Work completed to date… • 21 May 2011 was chosen for the initial case study, and the NSSL WRF was re-run so that 5-minute data could be saved • WRF output was used to generate simulated split window difference output, and the loop above shows that regions with locally increasing values (green to yellow to red) predicted where clouds (blue) would form. • Green areas indicate Doppler radar-derived convergence, overlaid on parallax-corrected GOES-13 Visible imagery from 21 May 2011 • The yellow circles highlight regions of dryline convergence detected by the clear-sky radar technique