Download
1 / 35
350 likes | 483 Vues
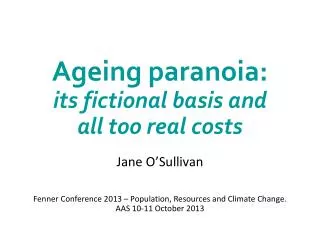
Ageing paranoia: its fictional basis and all too real costs. Jane O’Sullivan Fenner Conference 2013 – Population, Resources and Climate Change. AAS 10-11 October 2013. Ageing is the main excuse for maintaining population growth. Population growth is a policy variable (a choice).

E N D
Ageing paranoia: its fictional basis and all too real costs Jane O’Sullivan Fenner Conference 2013 – Population, Resources and Climate Change. AAS 10-11 October 2013
Ageing is the main excuse for maintaining population growth • Population growth is a policy variable (a choice). • A significant shift in policy in the past 20 years: • High fertility nations have reduced family planning. • Low fertility nations have resisted stabilisation. • A consequent resurgence in global population growth. Global population won’t peak unless nations embrace stabilisation or descent.
2012 UN Population Projections High 15.8 16.6 billion Medium 10.1 10.9 billion Low 6.1 6.8 billion
2012 UN Population Projections Constant Fertility 28.6 billion High 15.8 16.6 billion Medium 10.1 10.9 billion Low 6.1 6.8 billion
Projections are blind to carrying capacity High 15.8 16.6 billion Resource Constraints? Medium 10.1 10.9 billion Low 6.1 6.8 billion Joel Cohen “How Many People can the Earth Support”: 7-12 billion is “the zone” “If most people would prefer a decline in birth rates to a rise in death rates, then they should take actions to support a decline in fertility while time remains to realize that choice.”
Annual Increment of Population Constant Fertility Projection Medium Projection Recent estimates from Population Reference Bureau
Press briefing upon publication of UN’s “World Population Prospects: The 2012 Revision” “…Most of this increase is due to changes in our estimates of current fertility for several high-fertility countries … “Our medium-variant projection continues to assume a rapid fall in future levels of fertility for these countries. We continue to calibrate the pace of future fertility decline using the historical experience of countries that underwent a major reduction of fertility levels after 1950, in an era of modern contraception. The medium‐variant projection is thus an expression of what should be possible… “… [it] could require additional substantial efforts to make it possible.” John Wilmoth, Head of Population Division, UNDESA
Fertility reduction in response to population-focused family planning programs Typical fertility reduction of 2-3 units per decade in the first two decades. (UN projection assumes 1 unit per decade.)
International support for family planning has fallen Allocation of international funding for “Population Assistance”from S.W. Sinding 2009. Population Poverty and Economic Development. Phil. Trans. R. Soc. B 2009 364, 3023-3030.
Fertility rebound in developed countries from: Myrskyla et al. 2009 “Advances in development reverse fertility declines”
Ageing is an inevitability of the demographic transition from: Productivity Commission 2005: “Economic Implications of an Ageing Australia”
Population growth only partly delays ageing TFR=2, NOM=220,000 TFR=2, NOM=0 “Real” dependency ratio?: (<20 & >70) / 20-70 Dependency Ratio: (<15 & >65) / 15-65 Aged dependency: >65 / 15-65 % over 65
The “3 Ps”: GDP = Population x Participation x Productivity Assumptions: • Natural resources don’t count. • Diluting, degrading and depleting them will not affect per capita wealth, because they are not in the model. • Job seekers create jobs. • The size of the economy will be proportional to the number of working age people. • The 3 factors are independent. • Population growth will not reduce participation (competition for jobs) or productivity (competition for resources and markets). • Growth rate costs nothing. • The infrastructure, equipment and professional personnel that added people need will be created without penalty.
Self-affirming factorisation: • The “Kaya formula” for global emissions is another example: Emissions = Population x GDP/person x Energy Intensity of $ x Carbon intensity of energy
The first “P”: Population- but wealth is a per capita thing! • Did population growth help Australia avoid the GFC? • Negative per capita growth for >4 quarters – made deeper by population growth. • Population growth delinks GDP from wealth.
So, does population growth increase participation or productivity? • The ageing argument: keep the proportion of working age people high. • Productivity Commission 2011 • “Plausible increases in fertility and net migration would have little impact on ageing trends.” • “any effect would be short lived. This is because immigrants themselves age” • “to maintain the age structure of 2003-04 in 2044-45, annual migration during that period would need to be above 3 per cent of Australia’s population, leading to a population of over 100 million by the middle of this century” • Sustainable Australia Report 2013: • “every 50,000 new migrants have roughly half the impact on ageing trends than the previous 50,000.”
Models show ageing will reduce participation Productivity Commission (2005) “Economic Implications of an ageing Australia” The unemployed are unlikely to take up the slack because: “Unemployed people and people outside the labour force are generally different from the employed in skill, motivation and aptitude.”
The real world experiment • Is the proportion of people employed governed by the supply of people of working age, or by the supply of work? • There is no correlation between ageing and proportion of people employed.
The real world experiment • Is the proportion of people employed governed by the supply of people of working age, or by the supply of work? • The differences are even smaller when part-time work is considered.
The real world experiment • Does population growth increase productivity? • There is no trend among nations, nor among municipalities (USA).
Are we measuring productivity decline as GDP growth? • Density diseconomies: Infrastructure Australia (2011) • “The cost of providing new infrastructure is rising faster than the rate of inflation — in part, because costlier construction options, such as tunnelling for new roads, now need to be adopted in the large cities.” • Unremunerated costs of labour: Grattan Institute (2013): • on the perimeters of Brisbane, Sydney, Melbourne and Perth, more than 90 per cent of jobs are at least an hour away on public transport. • Residential housing debt tripled since 2003.
What about wealth distribution? • Does a growing workforce create more opportunities for the needy? • The most youthful nations have the poorest poor. • “Because immigration makes labour more abundant relative to the existing stock of capital and land, it tends to increase the returns to the latter at the expense of labour.” – Productivity Commission 2011
What about wealth distribution? • The GINI coefficient measures inequality of income: • Greater inequality is associated with worse physical health, mental health, drug abuse, education, imprisonment, obesity, social mobility, trust and community life, violence, teenage pregnancies, and child well-being (Wilkinson & Pickett, “The Spirit Level” 2009)
What about Pensions and Health Care Costs? • If the labour market is oversupplied, pensions only replace unemployment and disability benefits. • Raising the pension age by 3-5 years negates change in working age proportion. … but is not needed if labour supply holds up. • The worst trends for retirement funding are housing inflation and casualised work. … a generational time-bomb imposed by population growth.
Can population growth offset Health Care Costs? • Most increase in health costs is due to changing treatment technologies and expectations. • Cost is related more to proximity to death than to age. • Proportion of adults with <15 years life expectancy in creases at half the rate of old-age dependency. • Proportion of adults with disabilities increases even less. • However, death rate will increase with ageing – only partly offset by population growth. • Why is expanding construction regarded as economic boom, but expanding health care regarded as a burden?
Remeasuring Ageing Data from Sanderson & Sherbov, “Remeasuring Ageing” Science 329:1287-1288, October 2010.
What about the cost of growth rate? • A higher population growth rate means a greater proportion of total economic activity dedicated to expanding infrastructure, equipment and skills. • For each 1% p.a. population growth, around 7-10% of GDP is needed for expansion. • Govt infrastructure spending has been around 1.85% of GDP per 1% p.a. growth. • The increased burden is proportional to the lifespan of the assets to be multiplied. • If infrastructure lasts 50 years, maintenance requires creation of 2% of the stock per year. 2% population growth doubles this burden. • This is an “opportunity cost” – income that would otherwise be available for wellbeing of existing people.
Cost of ageing vs. growth • Difference in all age-related costs between stabilising around 25 million (IGR1) and “Big Australia” projection (IGR3) is 1% of GDP by 2050. • Public Infrastructure cost of growth has historically been around 2.6% of GDP (1.85% per 1% population growth) but is currently over 3.3% an rising. (Not included in the IGRs.) • Expect energy and materials costs to outpace inflation. • More than doubles the cost of decarbonising the economy. • Loss of biodiversity, food and water security, public amenity and quality of life.
Depopulation Dividends German perspectives (Kluge et al. 2013): • Smarter? - greater proportion with higher ed. • Cleaner? - fewer greenhouse gases. • Richer? - concentration of inheritance. • Healthier? - greater proportion of life in wellness. • Happier? - more leisure in the life cycle.
In summary: Population growth • Delinks GDP from wealth • Doesn’t strengthen workforce • Doesn’t increase productivity • Increases poverty and inequality • Diverts income from wellbeing to infrastructure creation • Reduces per capita resources • Increases climate change and biosphere impacts • Creates increasingly interdependent and brittle socio-economic conditions.
Remember the Millennium Bug? • Like ageing, the trigger conditions are inevitably reached. • But the dire consequences are conspicuous only by their absence. • In the mean time, we are turning our backs on real threats.