Download

1 / 49
490 likes | 507 Vues
Learn how to communicate project information effectively, analyze the critical path, filter tasks, format Gantt charts, work with the Network Diagram, and analyze task constraints using Microsoft Project 2007. Improve project planning and shorten project timelines.

E N D
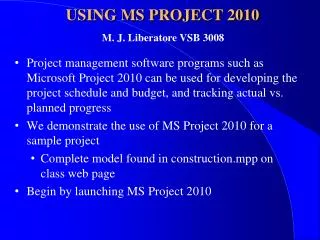
New Perspectives on Microsoft Project 2007: Communicating Project Information
In this tutorial you will: • Review Project 2007 reports • Examine the critical path • Filter tasks • Format a Gantt Chart • Work with the Network Diagram • Analyze task constraints Presentations Created by C. Hester - Microsoft Project 2007 by Bunin
Case: LAN Project • Your project has been viewed by the project manager: Emily King • The Finish date that Project 2007 calculated is 2 weeks later then anticipated. • Use Project 2007 features such as reports, filters, and custom formats to emphasize, analyze, and shorten the critical path so the project finishes earlier. Presentations Created by C. Hester - Microsoft Project 2007 by Bunin
Creating Reports Using Project 2007 • Reports can communicate project information • Reports disseminate information • Use reports for project status • Use reports to plan a project • Viewing different reports will help you to analyze your current project plan in different ways. Presentations Created by C. Hester - Microsoft Project 2007 by Bunin
Project 2007 Reports Presentations Created by C. Hester - Microsoft Project 2007 by Bunin
Understanding the Critical Path • A critical task is a task that must be completed as scheduled in order for the project to finish as of the Finish date. • Any delay in a critical task could delay the project completion date. • The critical path is the series of critical tasks (or even a single critical task) that indicates the calculated Finish date of the project. • The critical path determines the earliest the project can be completed. Presentations Created by C. Hester - Microsoft Project 2007 by Bunin
Understanding the Critical Path Cont’d • The critical path changes if tasks on the critical path are completed ahead of or behind schedule. • Another way to define the critical path is that it consists of those tasks having a float of zero. • Float, also called total slack, is the amount of time that a task can be delayed from its planned start date without delaying the project Finish date. Presentations Created by C. Hester - Microsoft Project 2007 by Bunin
Understanding the Critical Path Cont’d • Total slack differs from free slack. Free slack is the amount of time that a task can be delayed without delaying any successor tasks. • If any tasks on the critical path take longer then planned, the project completion date will slip unless corrective action is taken. • Viewing the Network Diagram makes it easy to see the critical path because critical tasks are automatically displayed in red. Presentations Created by C. Hester - Microsoft Project 2007 by Bunin
Critical Path Presentations Created by C. Hester - Microsoft Project 2007 by Bunin
Project Manager • It is very important for a project manager to have excellent skills in finding, analyzing, and communicating information about the critical path throughout the life of the project. • Filters, formats, and customizing the Network Diagram help the manager accomplish this. Presentations Created by C. Hester - Microsoft Project 2007 by Bunin
Filtering Tasks for Information • A filter temporarily hides some of the tasks so that only those tasks that you are interested in are displayed. • Filters help you to focus your attention on specific aspects of the project based on different criteria. • Project 2007 offers many build-in filters, available using the Filter list arrow on the Formatting toolbar. • One of the most important filters used is “Critical” because it filters out all tasks not currently on the critical path. Presentations Created by C. Hester - Microsoft Project 2007 by Bunin
Filtering Tasks for Information Cont’d • Filters can be applied in any view, but each view is filtered independently of the others. • Other filters such as Milestones, Task Range, and Date Range can be used at any time. • Filters temporarily hide those tasks that do not meet the filter criteria. • It is also important to note that filters are only “correct” as of the moment they are applied. • Recommended not to make changes in filter views. Presentations Created by C. Hester - Microsoft Project 2007 by Bunin
Filter List Options Presentations Created by C. Hester - Microsoft Project 2007 by Bunin
Filters Presentations Created by C. Hester - Microsoft Project 2007 by Bunin
Using the AutoFilter • The AutoFilter allows you to determine the filter criteria by selecting from a criteria list associated specifically with each column in the Entry table. • When you select AutoFilter on the Formatting Toolbar, a list arrow is displayed to the right of each field name in the Entry table. • You choose filter criteria for a column by clicking the list arrow in the column heading. • You can apply custom filters using the AutoFilter list arrows. Presentations Created by C. Hester - Microsoft Project 2007 by Bunin
AutoFilter Presentations Created by C. Hester - Microsoft Project 2007 by Bunin
Custom AutoFilter Presentations Created by C. Hester - Microsoft Project 2007 by Bunin
Printing Filtered View • You can print any filtered view of a project. • Entering information such as your name, the date, perhaps a time, and filename into the header and footer sections help identify the project file on the printout. • This can be helpful when presenting a filtered list of tasks. Presentations Created by C. Hester - Microsoft Project 2007 by Bunin
Formatting a Project • Sometimes you want to highlight information in a project by changing the appearance of the default views. For example: • Change the color of certain types of task bars. • Change the text font size within a table. • Project 2007 provides many ways to format the colors, shapes, and text within each project view to help you clearly communicate your message. Presentations Created by C. Hester - Microsoft Project 2007 by Bunin
Changing Bar Style Presentations Created by C. Hester - Microsoft Project 2007 by Bunin
Formatting a Gantt Chart • Project 2007 applies default formatting choices such as blue for task bars and black for summary bars. • You can change the default options individually or by using the Gantt Chart Wizard. • Enhancing the appearance of certain task bars of a Gantt Chart customizes the project and helps you communicate the information to management. Presentations Created by C. Hester - Microsoft Project 2007 by Bunin
Formatting a Gantt Chart Cont’d • Project 2007 has many formatting options for the Gantt Chart. • The key to formatting the Gantt Chart is that the final product should clearly and quickly communicate the information that is important to the project manager and management. • As the project progresses, you can always reformat the Gantt Chart to highlight any new important messages. Presentations Created by C. Hester - Microsoft Project 2007 by Bunin
Formatted Gantt Chart Presentations Created by C. Hester - Microsoft Project 2007 by Bunin
Formatting an Entry Table • You can click any cell within the Entry table and choose a new font, font size, font effect, or color. • By visually organizing the tasks, you help communicate what needs to be done in the project. • Formatting tasks by category changes all formatting for the specified category. • Formatting options are available to help you communicate project information to management as you work with Project 2007. Presentations Created by C. Hester - Microsoft Project 2007 by Bunin
Text Style Dialog Box Presentations Created by C. Hester - Microsoft Project 2007 by Bunin
Formatting Individual Items in the Entry Table and Gantt Chart • Many options on the Formatting toolbar and Format menu are used for formatting individual tasks. For example: • Format the tasks that you have assigned to an outside contractor with an italic font. • Temporarily change the color of one Gantt Chart bar to highlight it for a meeting. Presentations Created by C. Hester - Microsoft Project 2007 by Bunin
Individual Formatting Changes Applied Presentations Created by C. Hester - Microsoft Project 2007 by Bunin
Timescale • The timescale can display three tiers simultaneously. • You may be working on a project that requires that level of detail on the timescale. • You can set the timescale to show all three tiers and format each one. Presentations Created by C. Hester - Microsoft Project 2007 by Bunin
Timescale Presentations Created by C. Hester - Microsoft Project 2007 by Bunin
Working with the Network Diagram View • Network Diagram most clearly identifies the dependencies (also called relationships) between the tasks, as well as, the critical path. • You need to be able to complete basic actions such as entering and editing tasks in any view that you use. Presentations Created by C. Hester - Microsoft Project 2007 by Bunin
The Network Diagram Presentations Created by C. Hester - Microsoft Project 2007 by Bunin
Examining Dependencies and the Critical Path • The primary purpose of the Network Diagram is to clearly illustrate the sequential progression of tasks and the critical path. • Project managers often use the Network Diagram view to enter and edit task dependencies. Presentations Created by C. Hester - Microsoft Project 2007 by Bunin
Task Dependency in Network Diagram View Presentations Created by C. Hester - Microsoft Project 2007 by Bunin
Moving Tasks for Printouts • Network Diagram printouts can be quite wide, so you might want to move tasks in order to better arrange them for printouts. • If you plan to show them to your colleagues or to management, you must be organized so as to best communicate the information. Presentations Created by C. Hester - Microsoft Project 2007 by Bunin
Previewing the Network Diagram Presentations Created by C. Hester - Microsoft Project 2007 by Bunin
Shortening the Critical Path by Using Task Information • Directly modifying the task information for a critical task is the easiest way to shorten the path. For example: • If a critical task has an initial duration of 3 days and is modified to be completed in 2 days, the critical path will automatically be reduced by 1 day. • You want to focus on shortening tasks with the least incremental cost. • Another common term used in shortening project schedules is fast tracking. Presentations Created by C. Hester - Microsoft Project 2007 by Bunin
Shortening the Critical Path by Using Task Information Cont’d • To shorten the path only for the sake of shortening the project on paper serves no meaningful purpose — it only confuses and stresses out the project participants. • Strive to find ways to shorten the critical path by using techniques that can be readily accomplished once the project is started. Presentations Created by C. Hester - Microsoft Project 2007 by Bunin
Shorten the Critical Path by Modifying Task Information Presentations Created by C. Hester - Microsoft Project 2007 by Bunin
Fast Tracking • Fast tracking is when you perform activities in parallel that you would normally do in sequence. For example: • You might have planned to finish all of the analysis work before starting design, but you decide to start the design when the analysis is 75 percent complete. Presentations Created by C. Hester - Microsoft Project 2007 by Bunin
Changing Task Durations • Probably the quickest way to shorten the critical path is by directly shortening the durations of critical tasks. • In reality, it must be examined to determine whether the tasks can be accomplished in the shorter time frame. Presentations Created by C. Hester - Microsoft Project 2007 by Bunin
Changing Task Dependencies • Another common way to shorten the critical path is to examine and modify task dependencies. • Sometimes a Finish-to-Start (FS) dependency is created when it is not necessary. • Sometimes a dependency that requires less total time, such as a Start-to-Start (SS) or Finish-to-Finish (FF) dependency, would be appropriate. Presentations Created by C. Hester - Microsoft Project 2007 by Bunin
Negative Lag Time • Another technique to shorten the critical path is to add negative lag time to an existing Finish-to-Start (FS) dependency between two critical tasks. • Negative lag time always allows the tasks to overlap, regardless of whether the project is scheduled from a given Start or Finish date. • When a project is scheduled from a given Start date, negative lag time pulls the second task in the dependency backward in time. Presentations Created by C. Hester - Microsoft Project 2007 by Bunin
Changing Task Dependencies • Yet another way to use dependencies to shorten the critical path is to change the dependencies type from Finish-to-Start (FS) to Finish-to-Finish (FF) or Start-to-Start (SS), in which the task durations automatically overlap. Presentations Created by C. Hester - Microsoft Project 2007 by Bunin
Changing Calendar and Task Constraints • If you know of a task whose working time does not follow that of the Standard calendar, you should create a special calendar with the appropriate working and nonworking times and assign it to that task. • Another way to shorten the critical path is to analyze and eliminate unnecessary date constraints that have been applied to the tasks within your project. • A constraint is a restriction that you put on a task’s Start or Finish date. Presentations Created by C. Hester - Microsoft Project 2007 by Bunin
Changing Calendar andTask Constraints Cont’d • Be very careful about entering date constraints because they will definitely remove some flexibility in recalculating individual task Start and Finish dates. • Project 2007 places an icon in the Indicator column for any constraint other than As Soon As Possible and As Late As Possible to alert you. Presentations Created by C. Hester - Microsoft Project 2007 by Bunin
Constraint Types Presentations Created by C. Hester - Microsoft Project 2007 by Bunin
Constraint Applied Presentations Created by C. Hester - Microsoft Project 2007 by Bunin
View of Final Project Presentations Created by C. Hester - Microsoft Project 2007 by Bunin
Comparison of Gantt Chart andNetwork Diagram View Presentations Created by C. Hester - Microsoft Project 2007 by Bunin