Download
1 / 42
420 likes | 506 Vues
This presentation, given at the TRB National Transportation Planning Applications Conference in May 2007 by Phil Shapiro and Frank Spielberg from VHB, discusses a survey conducted to assess the current state of practice in Metropolitan Planning Organization (MPO) travel forecasting procedures. The study objectives, survey purpose, process, and findings related to model characteristics, trip generation, trip distribution, mode choice, assignment, demographic forecasts, trip types, and model validation are outlined.

E N D
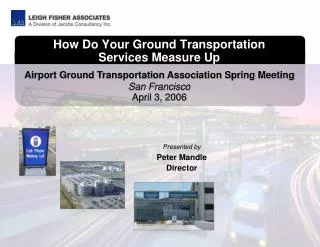
How Does Your Model Measure Up Presented at TRB National Transportation Planning Applications Conference by Phil Shapiro Frank Spielberg VHB May, 2007
The presentation that follows is based on a survey conducted for the TRB Committee to determine the “State-of-the-Practice” of MPO Travel Forecasting Procedures in 2005. The Final Report of the TRB Committee has not been published. Therefore, minor details of the data are subject to change but the overall findings are valid. Disclaimer
Study Objectives • ”… gather, organize, describe and interpret information on the current “state of the practice....” • Present cogent picture • Summarize data in ways that aid TRB panel judge correct characterization
Survey Purpose • Obtain travel forecast procedures from broad sample of MPOs • Sufficient detail to permit assessment & categorization of methods • Survey Instrument Design • Respond to 21 committee questions • Additional questions identified by study team
Survey Process • Web-based survey designed by VHB • Pre-tested by five MPOs • Distributed in late June to 381 MPOs • TRB (Jon Williams), AMPO, NARC and AASHTO encouraged responses
Model Characteristics • Majority of MPOs use 4-step process • Few MPOs use tour-based methods • Many MPOs omit mode choice • Some MPOs do no travel forecasting
Trip Generation • Unit of travel • “Total Person Trips” for midsize and large MPOs • “Vehicle trips” & “Total Person Trips” evenly split for small MPOs • Trip generation model • Cross-classification for trip productions • Regression analysis for trip attractions
Trip Distribution • Gravity Model dominant methodology • Distributes person trips • Impedance • Mostly based on travel time over highway network • Significant portion of large MPOs use function combining highway and transit times or other factors • Less than 1/2 of reporting MPOs apply some type of adjustment factors • “K” factors • Time penalties • Some do not use “K” factors because they do not validate model results
Mode Choice • Home-based work mode choice model • Used by 94% of large MPOs • 54% of mid-size MPOs • 21% of small MPOs • Functional form overwhelmingly multinomial or nested logit
Top Ten Best Features as Reported by MPOs* • Multipath Transit Assignment * Actually eleven – there was a tie for tenth place
What method is used for transit assignment? • Assignment of transit trips is typically a single path method based on minimum time, weighted or unweighted, or impedance
Top Ten Best Features as Reported by MPOs • Multipath Transit Assignment • Detailed Operations Outputs • Accurate Land Use Data
How are demographic forecasts allocated to sub-areas or zones? • Allocation of population, households and employment forecasts to TAZs within a region is completed by negotiation or based on Master Plan Zoning in over half of reporting MPOs.
Top Ten Best Features as Reported by MPOs • Multipath Transit Assignment • Detailed Operations Outputs • Accurate Land Use Data • Intersection Impedances • GIS Base • Multiplicity of Transit Purposes
What trip types are represented in the trip generation models? • Overall 60% of MPOs report using four person trip categories. These are HB Work, HB shop/retail, NHB and one other purpose. • Only 30% of large MPOs use only these purposes. Large MPOs, on average, use between 5 and 6 trip purposes. • Cross classification models are the dominant type of trip production model
Top Ten Best Features as Reported by MPOs • Multipath Transit Assignment • Detailed Operations Outputs • Accurate Land Use Data • Intersection Impedances • GIS Base • Multiplicity of Transit Purposes • Mode/Mode Choice Model
What is the form of the mode choice model? – Large MPOs • 72% of large MPOs use nested logit models.
Top Ten Best Features as Reported by MPOs • Multipath Transit Assignment • Detailed Operations Outputs • Accurate Land Use Data • Intersection Impedances • GIS Base • Multiplicity of Transit Purposes • Mode/Mode Choice Model • Standardized Model • Zone/Network Details
How completely do networks represent transportation facilities? • Most large MPOs model 100% • Freeways • Major arterial • Minor arterials • Most Large MPOs do not model local roads
Top Ten Best Features as Reported by MPOs • Multipath Transit Assignment • Detailed Operations Outputs • Accurate Land Use Data • Intersection Impedances • GIS Base • Multiplicity of Transit Purposes • Mode/Mode Choice Model • Standardized Model • Zone/Network Details • Well calibrated and validated
When was the model last validated? • Large MPOs • Over 50% validated models since 2004 • Around 80% validated models since 2001
From the last model validation, what is the percent root mean square error comparing traffic counts with highway link volumes for all links with counts and for each functional or volume class? • RMS error for all link classes tends to range from 20% to 40% with a 50th percentile value of about 30%.
From the last model validation, what is the percent root mean square error comparing traffic counts with highway link volumesfor all links with counts and for each functional or volume class? • For freeways, RMS ranges from 0% to 30% and the 50th percentile RMS error is 19%.
From the last model validation, what is the percent root mean square error comparing traffic counts with highway link volumes for all links with counts and for each functional or volume class? • As with all link classes, RMS error for major arterials tends to range from 20% to 40% with a 50th percentile value of about 30%.
Top Ten Best Features as Reported by MPOs • Multipath Transit Assignment • Detailed Operations Outputs • Accurate Land Use Data • Intersection Impedances • GIS Base • Multiplicity of Transit Purposes • Mode/Mode Choice Model • Standardized Model • Zone/Network Details • Well calibrated and validated • Ease of use/Flexibility
Top Ten Worst Features as Reported by MPOs • Lack of tour-based or activity model
Are you working toward any activity or tour-based approaches to replace the existing trip distribution model? • Large MPOs are more likely to be working toward replacing the existing trip distribution model with an activity or tour-based method than small or medium-sized MPOs.
Top Ten Worst Features as Reported by MPOs • Lack of tour based activity model • No mode choice model • Lack of commercial vehicle/truck/freight modeling
How is freight movement modeled? • About 20% of the agencies reporting used a synthetic trip table, about 25% use a factoring procedure. • The remaining 55% report use of an “Other” method, generally a gravity model.
Top Ten Worst Features as Reported by MPOs • Lack of tour based activity model • No mode choice model • Lack of commercial vehicle/truck/freight modeling • Lack of toll/HOT lane modeling • Lack of recent quality calibration • Lack of recent travel survey data
When was the last home interview survey conducted? • Since 1991, 93 percent of large MPOs, compared with 80 % of all MPOs, conducted a household travel survey. • 22% of large MPOs conducted a household travel survey between 2001 and 2005, compared with 32 percent of all MPOs. • 2/3 of large MPOs have conducted a survey since 1996.
Top Ten Worst Features as Reported by MPOs • Lack of tour based activity model • No mode choice model • Lack of commercial vehicle/truck/freight modeling • Lack of toll/HOT lane modeling • Lack of recent quality calibration • Lack of recent travel survey data • Lack of time of day modeling • Trip generation • Lack of detail/quality of mode choice on model
What transit modes are modeled? – Large MPOs • Drive Alone, 2 person auto, and local bus are the most frequently included modes. • Rail appears in about a third of the models, and where rail is used it is typically in a nested structure with walk-to-rail and drive-to-rail treated separately. • Over 1/3 or the large MPOs claim to treat Walk as a separate mode and 26% list Bike as a mode used in their mode choice model. • About one-third of the large MPOs report having a separate mode-of-access model.
Top Ten Worst Features as Reported by MPOs • Lack of tour based activity model • No mode choice model • Lack of commercial vehicle/truck/freight modeling • Lack of toll/HOT lane modeling • Lack of recent quality calibration • Lack of recent travel survey data • Lack of time of day modeling • Trip generation • Lack of detail/quality of mode choice on model • Land use forecasting
How are demographic forecasts allocated to sub-areas or zones? • Allocation of population, households and employment forecasts to TAZs within a region is completed by negotiation or based on Master Plan Zoning in over half of reporting MPOs.