Download
1 / 34
340 likes | 438 Vues
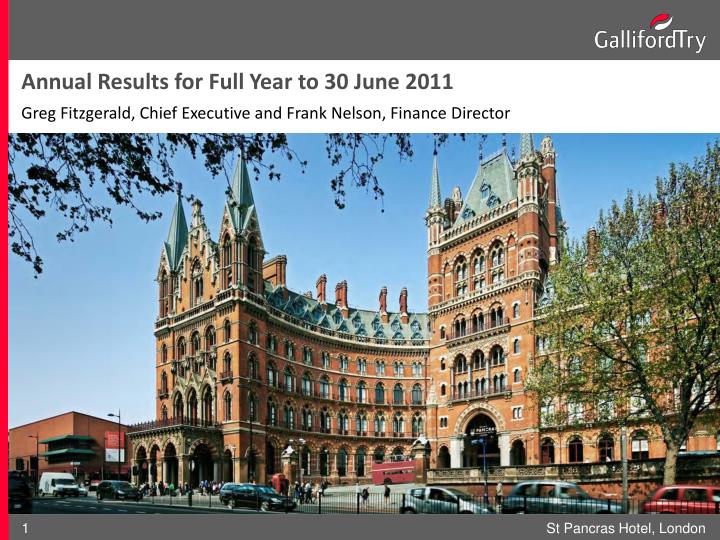
Annual Results for Full Year to 30 June 2011 Greg Fitzgerald, Chief Executive and Frank Nelson, Finance Director. St Pancras Hotel, London. Agenda. Overview and Highlights Financial Review Operating Review Summary Outlook and Strategic Update. Overview and Highlights.

E N D
Annual Results for Full Year to 30 June 2011 Greg Fitzgerald, Chief Executive and Frank Nelson, Finance Director St Pancras Hotel, London
Agenda • Overview and Highlights • Financial Review • Operating Review • Summary • Outlook and Strategic Update
Overview and Highlights Boxgrove Gardens, Guildford
Overview • Robust business model: • Strong housebuilding platform: • Top quartile construction business: • Growth and income: Strong financial performance Expansion plan on target for 3,000 units Industry leading margin and cash Dividend up 28%
Highlights Strong results Profit Before Tax1 up 35% Dividend up 28% £35m 16.0p 12.5p £26m 2010 2011 2010 2011 Housebuilding Margin up 45% Construction Margin unchanged 8.1% 2.4% 2.4% 5.6% 2010 2011 2010 2011 1Pre-exceptional
Financial Review Evolve, Devonport
Financial Review Income Statement
Financial Review Segmental Analysis 1. Revenue includes share of joint ventures
Financial Review Balance Sheet Highlights
Financial Review Cash Flow Summary 1Before working capital movements 2Includes £4.1m bank facility arrangement fee
Financial Review Key Financial Metrics Housebuilding - gross margin %1 Construction - cash as % of revenue 23 22 17.3 21 20 14.3 12.7 9.2 9.9 6.5 5.6 3.7 6.2 7.1 7.8 8.1 2008 2009 2010 2011 2009 2010 HY1 11 HY2 11 Operating margin Overhead Excellent margin progress Robust cash position 1 Pre-exceptional and after sales costs of circa 2%
Financial Review Dividend 16.0p 12.5p 10.9p 2009 2010 2011 28% increase in dividend Pre exceptional dividend cover 2.7 x One third PBT dividend policy established
Operating Review Housebuilding Holberton, Devon
Operating Review - Housebuilding 2011 Key Achievements SALES C/FORWARD Up 23% £247m (2010: £201m) COMPLETIONS Up 27% 2,170 (2010: 1,705) MARGIN Up 45% 8.1% (2010: 5.6%) LAND BANK Up 7% 10,250 (2010: 9,600) AVGE SALES PRICE1 Up 10% £227k (2010: £207k) 1 Excludes Affordable
Operating Review - Housebuilding Completions Analysis By sector By land bank By area of operation 67% 47% 74% • Private 1,446 • Affordable 724 2,170 • Post July 2008 1,020 • Legacy 1,150 2,170 • South 1,614 • Midlands/East 556 2,170
Operating Review - Housebuilding Land Bank Analysis By acquisition period Geographical split By sector Product mix1 70% 74% 80% 65% • Post July 2008 7,200 • Legacy 3,050 10,250 South 7,550 Midlands/East 2,700 10,250 Private 8,250 Affordable 2,000 10,250 • Houses 5,350 • Apartments 2,900 8,250 1. Excludes affordable
Operating Review - Housebuilding Land Bank Delivery Development Revenue £m Average Margin1 £0.7bn £1.5bn £2.2bn 10% 21% 18% 10,000 8,000 6,000 4,000 2,000 0 7,200 10,250 3,050 Legacy Post July 2008 TOTAL 1. Blended private/affordable – after sales costs of circa 2%
Operating Review - Housebuilding Land Bank/Completions - Key Indicators to 2014 Number of sales outlets Land bank by acquisition period Completions by period 115 105 100 78 June 11 June 12 June 13 June 14 June 11 June 12 June 13 June 14 June 11 June 12 June 13 June 14 Acquired post July 2008 Legacy Post July 2008 land Legacy
Operating Review - Housebuilding Affordable Housing • Market adjustment to new affordable rent regime • Grant risk mitigated on legacy sites and upsides being secured • Secured partner status on HCA 2011/2015 framework • Awarded £3m for FirstBuy shared equity programme • Variable quality of public land releases under DPP • Joint venture opportunities with Housing Associations extended • Strong engagement with HCA and successful management of programmes
Operating Review Construction Biffa, Cannock
Operating Review - Construction 2011 Key Achievements MARGIN upper quartile 2.4% (2010: 2.4%) CASH industry leading £217m (2010: £207m) ORDER BOOK maintained £1.75bn (2010: £1.8bn) WORK SECURED maintained 80% (for 2011/12)(2010: 88%)
Operating Review - Construction Order Book By Activity By Division By Client Type 12 11 18 32 37 40 56 52 42 2009 2011 2010 Private Regulated Public £m Infrastructure 921 Building 673 Partnerships 156
Operating Review - Construction Order Book By Sector Building Infrastructure £m Commercial 204 Education 126 FM 123 Health 117 Other Public Sector 103 £m Water 563 Transport 228 Other Civil Engineering 40 Renewables 39 Communications 37 Energy from Waste 14
Summary Kingston Mills, Bradford-upon-Avon
Summary 2011 - Strong delivery continues Housebuilding • Margin growth on track • Operational infrastructure in place • Clear benefit from Southern/South East bias Construction • Margin held up in challenging market • Maintained order book gives revenue visibility • Robust risk management for current market continues • Delivery of strong cash balances maintained
Outlook and Strategic Update Forth Replacement Crossing
Housebuilding Prices and sales rates stable Strength in South East Mortgage market improving More clarity to planning environment Land opportunities Outlook Market Environment Construction • Public sector pipeline down • Increasing market competitiveness • Private sector recovering • Strength in London and South East
Outlook Galliford Try Housebuilding • Resilient sales since 1 July • Cancellation rates at 18% • Current sales in hand up 25% at £328m • Dependence on shared equity reducing • Sales rate 0.43 per site/week • 10,400 plot land bank with 72% new land • Strategic land bank stands at 1,200 acres • All plots for 2011/12 have detailed planning consent Construction • £1.7billion current order book • 90% projected revenue for 2011/12 secured • Competitive market will drive lower margins • Water revenues increasing into mid AMP cycle • Focus on rebalancing to private sector opportunities • Major projects secured, adding to visibility of revenue • Strength of balance sheet a real advantage
Strategic Update Strong progress towards our objectives 2012F HOUSEBUILDING Completions Margin Landbank New land CONSTRUCTION Order book Margin Year End Cash 2011 HOUSEBUILDING Completions 2,170 Margin 8.1% Landbank 10,250 New land % 70% CONSTRUCTION Order book £1.75bn Margin 2.4% Year End Cash £217m Group PBT £35.1m 2010 HOUSEBUILDING Completions 1,705 Margin 5.6% Landbank 9,600 New land % 56% CONSTRUCTION Order book £1.8bn Margin 2.4% Year End Cash £207m Group PBT £26.1m 2009 HOUSEBUILDING Completions 1,825 Margin 3.7% Landbank 7,800 New land % 14% CONSTRUCTION Order book £1.7bn Margin 2.4% Year End Cash £237m Group PBT £24.5m
Strategic Update Beyond 2012 – Sustainable growth • Robust business model: • Strong housebuilding platform: • Top quartile construction business: • Returns to shareholders Financial strength, cash efficient Excellent base to progress growth to 4,000 units Positioned for growth when markets improve Growth and income
Annual Results for Full Year to 30 June 2011 Greg Fitzgerald, Chief Executive and Frank Nelson, Finance Director Cherwell Services, M40
Appendices Balance Sheet/Debt Profile by Sector - Illustrative Only
Appendices Net Finance Costs
Disclaimer Sub- Heading This presentation is being made only to and is directed at persons who have professional experience in matters relating to investments falling within Article 19(1) of the Financial Services and Markets Act 2000 (Financial Promotion) Order 2005 (the “Order”) or any other persons to who it may otherwise lawfully be communicated (all such persons being referred to as “relevant persons”). Any person who is not a relevant person should not act or rely on this presentation or any comments made during the presentation. This presentation does not constitute or form part of, and should not be construed as, any offer or invitation to subscribe for, underwrite or otherwise acquire, any securities of the Company or any member of its group nor should it or any part of it form the basis of, or be relied on in connection with, any contract to purchase or subscribe for any securities in the Company or any member of its group or any commitment whatsoever. This presentation does not purport to contain all the information that may be required to evaluate any proposed transaction and should not be relied on in connection with any such potential transaction. Any recipient hereof should conduct its own independent analysis of the Company. Recipients should note that the Company will not update or otherwise revise this presentation. The financial information set out in this document does not constitute the Company’s statutory accounts. Statutory accounts for the financial year ended 30 June 2010, which received an auditors’ report that was unqualified and did not contain any statement concerning accounting records or failure to obtain necessary information and explanations, have been filed with the Registrar of Companies.