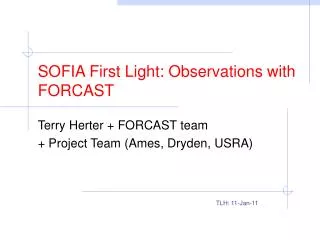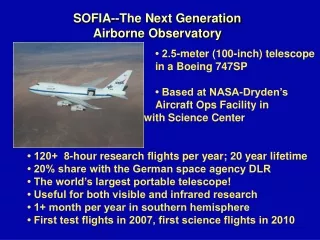
SOFIA GREAT Instrument: Terahertz Spectroscopy for Galactic Studies
The GREAT (German Receiver for Astronomy at Terahertz Frequencies) is a heterodyne spectrometer designed for the SOFIA telescope. It operates at terahertz frequencies, focusing on spectroscopy of key interstellar molecules like CII and HD, aiding in the exploration of both galactic and extragalactic interstellar mediums and circumstellar shells. With dual-channel hot-electron bolometer detectors and advanced backend options, GREAT achieves high sensitivity and spectral resolution, opening new avenues in astronomical research.

SOFIA GREAT Instrument: Terahertz Spectroscopy for Galactic Studies
E N D
Presentation Transcript
SOFIA First Generation Instruments Last Updated – 2012-09-14
GREAT: Heterodyne SpectrometerGerman REceiver for Astronomy at Terahertz frequencies • PI: R. Güsten, Max-Planck Institut, Bonn (guesten@mpifr-bonn.mpg.de) • Detector: dual channel hot-electron bolometer (HEB): Low: 1.25 - 1.50 THz (240 - 200 µm) & 1.82 - 1.92 THz (165 - 155 µm) Mid: 2.50 - 2.70 THz (120 - 110 µm) • Field of View: single element • R= 106 -> 108 • Science: Spectroscopy of CII (158 µm), HD (112 m), and many other molecules • Targets: Galactic and extragalactic ISM, circumstellar shells • Single-sideband (SSB) noise temperature: TSYS ~ 4000 K at 158 µm • High frequency 4.7 THz channel targeting [O I] 63 µm expected in 2013
GREAT Spectral Resolution The spectral resolution plotted corresponds to the FWHM of the instrument line spread function for a monochromatic line from a point source. Two backend options (AOS, CTS) are available: backend R instantaneous bandwidth AOS ~106 4 GHz CTS ~108 180 MHz Wavelength range: 60 - 200 µm ( ~2 - 5 THz) Three bandpasses: 1.6 - 1.9 THz (158 - 187 µm) 2.4 - 2.7 THz (110 - 125 µm) ~ 4.7 THz (~ 63 µm) Two of the three bandpasses will be installed for a flight. Frequency change within a bandpass requires about 10 minutes (TBC) . Wavelength setting accuracy corresponds to 0.2 - 0.003 km/s (TBC) Error in velocity determination 0.2 - 0.003 km/s for unresolved lines (TBC)
GREAT Sensitivity Sensitivity is shown for 0.01 km/s and 1 km/sec wide emission lines from a point source, for each of two planned resolutions in the three passbands. A 1 km/s line is resolved at either resolution; a 0.01 km/s line is not resolved at 1 MHz resolution (see p. 1). MDLF is the “minimum detectable line flux”, 4s in 15 minutes (900s). Also plotted for reference are curves for TA* = 1.4 K and 4.5 K for the 0.01 km/s line, and TA* = 0.14 K for the 1 km/s line. MDLF scales roughly as (S/N) /√ t where t = net integration time For a resolved line, MDLF scales according to: Calibration and setup overhead is very roughly 20% (TBC) Sensitivity is for a single sideband (SSB), single polarization receiver. Assumed system noise temperature includes measured receiver noise and estimated telescope & sky emission. In bright continuum sources, line measurements may take longer to reach the same S/N. Atmospheric transmission may preclude measurements at some wavelengths and reduce sensitivity at others.
GREAT Angular Resolution Beam size shown is the FWHM for nominal operating conditions. The approximate beam sizes in the three GREAT passbands are shown below scaled to an image of Saturn.
Faint ObjectinfraRedCAmerafor the Sofia Telescope: FORCAST 5 to 40 m Facility Camera • Detector:Si:As & Si:Sb BIB Arrays, 256 256 pixels • Plate Scale: 0.75”/pixel 3.2’ 3.2’ FOV • Spatial Resolution:(m)/10 arcseconds for > 15 m • Simultaneous Imaging in two bands: • Short:Continuum18.7, 21.0, 24.4 m • Sensitivity: 12-20 mJy 5 1 hour • PAH (5.5, 6.2, 6.7, 7.7, 8.6, 11.2 m), Line 18.7 m [SIII] • Long:Continuum 32.0, 33.2, 34.8, 37.6 m, • Sensitivity: 30-40 mJy 5 1 hour • Line 33.5 m [SIII], 34.6 m [SiII]
FORCASTSpectralPassbands Wavelength range: 5 - 40 µm. FORCAST has two arrays (Si:As for ~5 - 25 mm, and Si:Sb for ~25 - 40 mm) that can be used to simultaneously observe the same FOV. Top right: An ATRAN model of the atmospheric absorption as a function of wavelength in the FORCAST band (assuming zenith angle 45o and 7 mm of precipitable H2O). Bottom right: Filters include COTS line and continuum, and interference filters. Representative filter profiles are plotted. Short wavelength filters (as of 12/01): 5.61 µm (R=70) 7.69 µm (R=15) 6.61 µm (R=34) 8.61 µm (R=42) Cont. (R=34) 11.28 µm (R=56) 18.7 µm (R=15) 18.7 µm (R=15) 21.0 µm (R=15) 24.4 µm (R=30) Long wavelength filters (as of 10/01): 32.0 µm (R=15) cont. (R=800) 33.4 µm (R=30) 33.4 µm (R=800) 34.8 µm (R=30) 34.8 µm (R=800) > 36 µm (R=10) 37.6 µm (R=15)
FORCAST Sensitivity Sensitivity is shown for a continuum point source, at the effective wavelengths of ten of the filters listed on page one. The Minimum Detectable Continuum Flux (MDCF) in mJy needed to get S/N = 4 in 900 seconds is plotted versus wavelength. The red dots correspond to the expected SOFIA image quality at first light: 5.3 arc-sec (80% enclosed energy); the blue dots correspond to final SOFIA image quality: 1.6 arc-sec (80% enclosed energy). MDCF scales roughly as (S/N) /√ t where t = net integration time Calibration and setup overhead is roughly 10%. If telescope nodding is used during observations, this may also increase total observing time needed by 5% to 10%. Atmospheric transmission will affect sensitivity, depending on water vapor overburden. Sensitivity is also affected by telescope emissivity. Values plotted above are for telescope emissivity = 15%. At telescope emissivity = 5%, sensitivity would be 20% to 60% better (fainter).
Si:Sb l20 - 40 µm Si:As l5 - 25 µm 3.2 ’ 3.2 ’ 3.2 ’ FORCAST Angular Resolution FORCAST field of view is 3.2 arcminutes square (256 x 256 pixels). Imaging scale is 0.75 arcseconds per pixel. The camera optics are diffraction limited longward of l=15 mm FORCAST spatial resolution versus wavelength for different observatory performances specs.
FIRSTLIGHTINFRAREDTESTEXPERIMENTCAMERA: FLITECAM Large format array 1 to 5.5 m imager/spectrometer • Detector:InSb ALADDIN II, 1024 1024 pixels • Seeing limited imaging: plate scale 0.47"/pixel, 8' FOV • Continuum: J, H, K, Klong,, L, L’, M • Lines: e.g. Pa (1.88 m), Br 2.63 m imaging • Grism Spectroscopy: R~1300 with 2" wide slit (variable slit width from 1" 15") • 8' FOV efficient narrow-band imaging (Pa , Br , PAHs) • Survey the stellar populations embedded in star forming regions (e. g. Orion or M 16).
FLITECAMSpectralPassbands Capability to use narrow-band filters e.g.: C2 : 1.4, 1.8 µm Paschena : 1.88 µm Brackett d : 1.96 µm C2H2 : 2.0, 2.4, 2.6, 3.0, 3.8 µm Brackett b : 2.63 µm PAH: 3.3, 5.2 µm HCN: 3.5 µm Wavelength range: 1 - 5.5 µm Direct imaging mode, and grism spectroscopy mode. High-speed imaging at ~12 full frames per second, or 16x8 subframe at ~30 kHz. Broadband imaging filters: • Standard J, H, K, L’, M passbands • “KL” : 2.3 - 3.3 µm In-flight atmospheric transmission at grism resolution R = 2000, with planned broadband filter passbands, and grism orders indicated by labeled horizontal bars.
FLITECAM Sensitivity FLITECAM imaging sensitivity is shown for a point source, for each of the broadband filter bandpasses. The Minimum Detectable Continuum Flux (MDCF) density in µJy necessary to get S/N = 4 in 900s is plotted. The approximate magnitude value is also shown, based on magnitude = 0 for aLyr in all bands. Fast imaging sensitivity: at fastest full frame rate (~12/s), S/N ~4 for magnitude ~ 9 in K-band. At 10 kHz subframe rate, K mag. ~2 (TBC). The lower graph shows FLITECAM emission line sensitivity in grism mode, centered in the same bandpasses. MDLF is the “minimum detectable line flux”, 4s in 15 minutes (900s). MDLF scales roughly as (S/N) /√ t where t = net integration time Calibration and setup overhead time is roughly 10%
FLITECAM Angular Resolution Beam size shown is the instrument FWHM size for nominal operating conditions, including in-flight image quality. Format: 1024 x 1024 pixel array 0.48” x 0.48” pixels FWHM Beam Size, arcsec
HIGH-SPEEDIMAGINGPHOTOMETER FOROCCULTATIONS: HIPO • Dual-channel CCD Occultation photometer • Can co-mount with FLITECAM for additional IR channel • Occultation photometer - up to 50 Hz frame rate • Detectors: Two Marconi CCD47-20, 1024 1024 pixels • Seeing limited imaging: plate scale 0.33"/pixel, 5.6' FOV • Filters as desired • Wavelength coverage from ozone cutoff to silicon QE cutoff • Precise Photometry: Very low scintillation noise, stable PSF • Mobility: SOFIA allows observations from almost anywhere • Test the SOFIA telescope assembly imaging quality • Test Capabilities: Shack-Hartmann, retroreflection
HIPOSpectralPassbands Wavelength range: 0.3 – 1.1 µm Dual-channel high-speed direct imaging photometer. Modes include: Single frames Shuttered time series Frame transfer time series up to 50 Hz Short time series up to 10 KHz Broadband imaging filters: • Standard UBVRI passbands Narrow-band filters at, e.g.: • Methane filter at 0.89 µm Dichroic Reflectors: • HIPO will use a dichroic reflector to separate its channels. The transition wavelength for the first light dichroic has not been determined. Additional Filters: • Additional custom filters will be added for specific events
HIPO Sensitivity HIPO first-light sensitivity is shown here for several representative cases. The upper figures correspond to occultations by Pluto or Triton while the lower two are for the case of a very faint occulting object. The left and right figures are for 0.5 sec and 50 ms integrations, respectively. Each figure shows S/N for no filter (dichroic only) and for the dichroic plus standard Johnson filters. The dichroic transition is assumed to occur from 0.57 and 0.67µm. The deviation of S/N from a square root dependence is mostly due to shot noise on the occulting object in the top two figures, mostly to shot noise on the sky in the bottom left figure, and mostly to read noise in the bottom right figure. The improved final SOFIA pointing stability will increase sensitivity for sky-limited events and improve discrimination from nearby bright objects (e.g. Neptune for a Triton occultation).
8’ diameter SOFIA field HIPO Field of View: 5.6’ x 5.6’ (8’ diagonal) HIPO Angular Resolution Format: 1024 x 1024 pixel array Low resolution: 0.33” x 0.33” pixel High resolution: 0.05” x 0.05” pixel Pixels will normally be binned to best match the seeing blur size and to reduce the effect of read noise. High resolution mode includes no reimaging optics and will be used for shear layer imaging tests and for maximum throughput for certain occultations. Occultation photometry will be extracted from data frames using effective aperture sizes comparable to the 80% enclosed light diameter plotted here. The HIPO field is a 5.6’ square inscribed in the 8’ diameter SOFIA field. This figure shows the expected instrument FWHM beam diameter as a function of wavelength. It is expected to be dominated by seeing and image motion effects. The red curve in this figure is the nominal image quality expected at first light for SOFIA, based on the expected shear layer seeing, the as-built optical performance, and 2” rms image motion. The blue curve represents the ultimate combined optical quality and image motion requirement (80% encircled energy in a 1.6” diameter circle) convolved with the expected shear layer seeing. Also plotted are representative photometry aperture diameters likely to be used for processing occultation frames under both conditions described above. The image motion assumed is larger than will be experienced when observing at high frame rates.
105 104 103 EXES Spectral Resolution Wavelength range: 5 - 28 µm Three Resolving Powers: High: ~ 105 Medium: ~ 104 Low: ~3000 The resolving power plotted corresponds to the FWHM of the instrument line spread function for a monochromatic line from a point source. Wavelength changes require about 3 minutes. Resolution change requires about 3 minutes. Free spectral range : High: 1500 km/sec (echelle mode) Medium: 1500 km/sec Low: 6000 km/sec High Velocity Resolution (km/s) Spectral Resolving Power l/Dl Medium Low Wavelength (µm)
EXES Sensitivity MDLF is the “minimum detectable line flux”, 4s in 15 minutes (900s) on-source integration time. MDLF is plotted for an unresolved line from a point source, for each of the three resolution modes, Low, Medium and High. MDLF scales roughly as (S/N) /√ t where t = net integration time Minimum detectable continuum flux MDCF (4s, 15 minutes): l= 10 mm20 mm High: ~ 1.3 Jy ~ 2.7 Jy Medium: ~ 0.4 Jy ~ 0.9 Jy Low: ~ 0.2 Jy ~ 0.5 Jy Calibration, setup, and target acquisition take less than 20 minutes. Line measurements in bright continuum sources may take longer to reach the same (S/N). Atmospheric transmission may preclude measurements at some wavelengths and reduce sensitivity at others. Further details for particular wavelengths of interest are available from the SI team; see contact information on the title page. MDLF (W/m2), S/N = 4 in 900 s Wavelength (µm)
EXES Angular Resolution Beam size shown is the telescope + instrument FWHM for normal operation conditions. Spatial resolution along the slit limited by telescope performance. Slit width range = 1” – 4”; angular resolution shown for narrow slit (1.3” - 2.6”). Detector: 256 x 256 pixel array Mode: Format: Slit Length High: cross-dispersed 5” – 20” Medium: single order 40” - 90” Low: single order 40” - 90” Caveats: (1) Nodding efficiency ranges from 30% (nodding off slit) to 80% (nodding on slit) (2) Sensitivity assumes SOFIA is diffraction limited at l > 15 mm (3) Non-continuous spectral coverage in high-resolution mode for l > 13 mm Beam Size (arcsec) DIFFRACTION LIMIT Wavelength (µm) High: Medium: Low:
HAWCSpectralPassbands Wavelength range: 50 - 240 µm Four bandpass filters: Each passband is observed separately; time to change passbands is roughly 2 minutes. Reimaging optics provide match to diffraction limit in each passband (data on page 3).
HAWC Sensitivity Sensitivity is shown for an extended continuum source, for each of the four HAWC filter bandpasses. The graph shows the Minimum Detectable Continuum Flux (MDCF) density (mJy per beam) necessary for S/N = 4 in 900 seconds integration time, based on scaling from predicted NEFDs. Horizontal error bars indicate the half-widths of the filter transmissions. Calibration and setup overhead is roughly 10%. Atmospheric transmission will affect sensitivity, depending on water vapor overburden.
HAWC Angular Resolution Beam size shown is the instrument FWHM size for nominal operating conditions Format: 12 x 32 pixel array Notes: (1) Angular resolution shown is the root sum square of the pixel size and the diffraction limit. (2) SOFIA and all first light focal-plane instruments are now in development. All sensitivity and resolution data are preliminary, and based on anticipated performance of the observatory and the instruments. Actual performance of the SOFIA telescope and instrument combination will be established after flight operations begin. Telescope performance is expected to be upgraded during the first two years, and instrument performance may be upgraded, or additional modes or capabilities may be added. PERFORMANCE ESTIMATES GIVEN HERE ARE BASED ON DATA SUPPLIED BY THE INSTRUMENT TEAMS. A POINT OF CONTACT FOR EACH INSTRUMENT IS PROVIDED.
1000 1500 2000 3000 6000 FIFI-LS Spectral Resolution Wavelength range: 42 - 210 µm Two bands: Short (S): 42 - 110 µm Long (L): 110 - 210 µm The spectral resolution plotted corresponds to the FWHM of the instrument line spread function for a monochromatic line from a point source. Wavelength changes require about 2 minutes. Wavelength setting accuracy corresponds to 20 km/s Error in velocity determination 20 km/s for unresolved lines Free spectral range : 1500 - 3000 km/s in both bands S L Velocity Resolution (km/sec) Spectral Resolving Power l/Dl Wavelength (µm)
FIFI-LS Sensitivity MDLF is the “minimum detectable line flux”, 4s in 15 minutes (900s). MDLF is plotted for a monochromatic line from a point source, for each of the two spectral bands, S and L. MDLF scales roughly as (S/N) /√t where t = net integration time Minimum detectable continuum flux MDCF (4s, 15 minutes): ~ 1.1 Jy for S, ~ 1.1 Jy for L Calibration and setup overhead is very roughly 20%. Line measurements in bright continuum sources may take longer to reach the same (S/N). Atmospheric transmission may preclude measurements at some wavelengths and reduce sensitivity at others. Further details for particular wavelengths of interest are available from the SI team; see contact information on the title page. MDLF (W/m2), S/N = 4 in 900s Wavelength (µm)
l FIFI-LSAngular Resolution Beam size shown is a predicted FWHM image size for nominal operating conditions, calculated as the root sum square (RSS) of the pixel size and the diffraction-limited telescope image size. Format: 5 x 5 spatial and 16 spectral channels deep in l direction S: 6” x 6” pixel, 30” x 30” FOV L: 12” x 12” pixel, 60” x 60” FOV SOFIA and all first light focal-plane instruments are now in development. All sensitivity and resolution data are preliminary, and based on anticipated performance of the observatory and the instruments. Actual performance of the SOFIA telescope and instrument combination will be established after flight operations begin. Telescope performance is expected to be upgraded during the first two years, and instrument performance may be upgraded, or additional modes or capabilities may be added. PERFORMANCE ESTIMATES GIVEN HERE ARE BASED ON DATA SUPPLIED BY THE INSTRUMENT TEAMS. A POINT OF CONTACT FOR EACH INSTRUMENT IS PROVIDED. L DIFFRACTION LIMIT FWHM Beam Size, arcsec S
FIFI-LS Science Example:C II Data Cube in Interacting Galaxies