Missouri algorithm for N in corn
Missouri algorithm for N in corn. Peter Scharf, Newell Kitchen, and John Lory University of Missouri and USDA-ARS. Missouri Algorithm. Based on direct empirical relationship between measured reflectance and measured optimal N rate Site characteristics


Missouri algorithm for N in corn
E N D
Presentation Transcript
Missouri algorithm for N in corn Peter Scharf, Newell Kitchen, and John Lory University of Missouri and USDA-ARS
Missouri Algorithm • Based on direct empirical relationship between measured reflectance and measured optimal N rate • Site characteristics • Very compatible with current sensor group approach • We will likely use the algorithms that will be developed from group activities
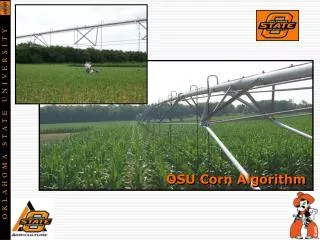
Missouri Algorithm • Original calibration: Cropscan passive at V6 • Green, Red edge, Blue-green best • Green/Infrared best combination • Optimal N rate = 330 * (G/NIR)target/(G/NIR)high N – 270 • Works with either 0 or 100 N applied preplant • Tentatively applied with Crop Circle active sensor • Subsequent research agrees fairly well
Relationship between optimal N rate and sensor measurements Y = 330(X) – 270
Greenseeker • Values swing more widely than Crop Circle over the same range of corn N status • Need equation with smaller slope
Growth stages • Original calibration was for V6 • Also use for V7 • Chlorophyll meter, sensor research show that slope decreases as season progresses • Decreased slope to 3/4 for V8 to V10
On-farm demos using Missouri algorithms • 7 in 2004 • 12 in 2005 • 19 in 2006 • 28 in 2007
Kansas producer 2006: 4000 acres of corn fertilized in six days using high-clearance spinner, sensors, & Missouri algorithm
On-farm demonstrations • 32 on-farm demonstrations 2004-2006 with producer rate & sensor variable-rate side-by-side and replicated • Average N savings = 31 lb N/acre • Average yield loss = 1.7 bu/acre • Yield & N economics • $2 to $10/ac benefit depending on prices used • Doesn’t count technology & management costs
On-farm demonstrations • Complication: sensor values change during the day • Probably mainly due to changes in: • Canopy architecture • Internal leaf properties • External leaf properties
Dew Rain Leaf wetness effect on sensor values
Why diurnal changes in sensor values? • Leaf wetness is the only reason we’re sure of • Wet leaves are darker • Need to re-measure high-N reference when leaf wetness changes • Reference strips perpendicular to rows can make this feasible
Reference strips • Perpendicular to rows? • Tried in on-farm demo in 2007 • Real-time update of high-N reference value • Worked great • Apply with 4-wheeler + spinner? • Aerial?
Diurnal changes: other impacts • We may consider changing to an algorithm based on NDVI • Especially Greenseeker • Less sensitive to diurnal changes in sensor values
Diurnal sensitivity of N recs: Greenseeker/cotton example NDVI-based VIS/NIR-based
Diurnal sensitivity of N recs: Crop Circle/cotton example NDVI-based VIS/NIR-based
Thanks!! Questions? Comments? Discussion?