Download
1 / 14
140 likes | 282 Vues
Urbana High School 2009-2010. School Improvement Dr. Laura Taylor. Changing Landscape of UHS. 2001 2009 White 67.3 48.4 African American 25.0 34.1 Low SES 25.2 51.6

E N D
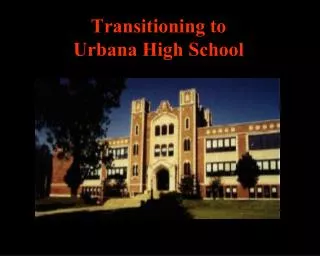
Urbana High School2009-2010 School Improvement Dr. Laura Taylor
Changing Landscape of UHS 2001 2009 White 67.3 48.4 African American 25.0 34.1 Low SES 25.2 51.6 Mobility Rate 19.1 22.3
3 Year Trend Data – Reading* 2007 2008 2009* All 52.2 58.6 56.7 White 64.8 74.2 70.4 African American 22.2 29.1 32.2 Low SES 31.0 37.2 36.2 Special Education 9.7 30.0
3 Year Trend Data – Math* 2007 2008 2009* All 44.1 59.5 48.8 White 56.3 73.3 64.8 African American 15.9 27.3 20.0 Low SES 25.3 33.3 26.6 Special Education 7.3 23.3
Things to Consider When Reviewing Data The bar was set high by the class of 2009 PLAN Data
PLAN to ACT - Composite PLAN ACT Difference 2002 19.3 21.5 +2.2 2003 19.5 22.1 +2.6 2004 18.8 21.8 +3.0 2005 18.4 21.0 +2.6 2006 19.0 21.1 +2.1 2007 17.2 2008 18.1
PLAN to ACT – Reading – 3.2 PLAN ACT Difference 2002 19.0 21.4 +2.4 2003 19.2 22.6 +3.4 2004 18.2 22.2 +4.0 2005 18.0 21.3 +3.3 2006 18.2 20.9 +2.7 2007 16.7 2008 17.7
PLAN to ACT – Math – 2.1 PLAN ACT Difference 2002 19.3 21.5 +2.2 2003 19.2 21.9 +2.7 2004 18.7 21.5 +2.8 2005 18.1 20.7 +2.6 2006 19.4 21.3 +1.9 2007 17.3 2008 17.9
Embrace the Positive News • African American students met in reading for the past two years and achieved the highest score they have had in reading in the past five years. • By maintaining in reading, we have brought students farther in terms of their achievement indicating our efforts in reading are paying off. This could be the same for math although we won’t know until next summer. • We have maintained/slight upward trend even though we have more low SES students.
It’s Not All About the PSAE 2007 2008 2009 Graduation Rate 85.1 92.0 92.5 African American 73.0 82.4 90.3 Special Education 71.1 87.0 79.1* Low-Income 81.0 84.7 89.3 Attendance Rate 91.0 93.4 92.7 Truancy Rate 15.5 4.8 3.6 Dropout Rate 2.2 2.0 0.4
It’s Not All About the PSAE 2006 2007 2008 2009 Suspensions 407 310 248 209 Referrals 3635 1953 1863 1522 Fights 60 27 10 12
Reclassification Retained 9th 10th All Spring 2006 76 31 135 Spring 2007 82 32 147 Spring 2008 52 20 92 Spring 2009 39 17 81
What Does This Mean for SI? It means….. we have demonstrated that as educators we can make a difference. we continue to cultivate a collaborative culture through the development of high performing teams. we maintain the course as a learning community committed to framing our decisions in terms of their impact on student learning.
It Means We Continue to Live by the Urbana High School Mission “Gladly Would We Learn and Gladly Teach” Gladly – Refers to the genuine optimism with which we serve each other and approach everything we do Would – Denotes sustained effort that begins in the present and extends to the future We – Refers to everyone – students, teachers, and community - and represents our shared commitment Learn – We will all learn from each other Teach – We will all teach each other