
Introduction
FROM FLAG LEAF EMERGENCE TO FLOWERING: INTERPRETING N CONTENTS FOR IRRIGATED WHEAT PROTEIN . B. Simko, B. Brown, S. Reddy, and J. Neufeld, Oregon State University and University of Idaho.

Introduction
E N D
Presentation Transcript
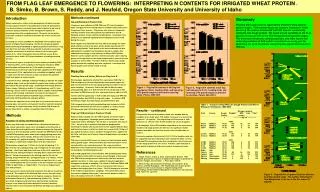
FROM FLAG LEAF EMERGENCE TO FLOWERING: INTERPRETING N CONTENTS FOR IRRIGATED WHEAT PROTEIN . B. Simko, B. Brown, S. Reddy, and J. Neufeld, Oregon State University and University of Idaho Figure 1. Flag leaf N contents at full flag leaf emergence (Fem), heading (Fhd), and flowering (FFl) growth stages as affected by planting dates. Parma, 2000-2001. Figure 2. Flag leaf N contents at full flag leaf emergence (Fem), heading (Fhd), and flowering (FFl) growth stages as affected by varieties. Parma, 2000-2001. Figure 3. Flag leaf N in 14 grower fields as affected by wheat growth stage. The number following the field designation in the key is the late season N applied. Introduction Higher market prices relative to the predominant soft white class has increased grower interest in the production of hard red spring wheat. Less hard red wheat is currently grown under irrigation in part due to concerns about productivity and the management required for producing wheat with acceptable protein. Discounts for low protein need to be avoided or minimized to maximize the returns for the hard red class. Increasing late season available N is frequently used to improve grain protein of irrigated hard red spring. But the N is frequently applied without knowing the likelihood of significant protein enhancement. Flag leaf total N concentration (FLN) was reported to provide a reasonable indication of the extent to which late season N can increase grain protein (1,2 ). Little if any protein increase with late season N was reported in these studies if FLN concentrations at heading measured 4.2-4.3%. Whereas most reports of flag leaf N involve sampling at heading (FHD) or flowering (FFL), earlier sampling at full flag leaf emergence (FEM) would provide additional time for (1) the wheat’s N status to be determined, (2) the decision made to provide supplemental N for protein enhancement, (3) the application to be scheduled and applied, and (4) in some cases the time necessary to fully incorporate the applied N either by irrigation or natural rainfall. In a practical sense, although sampling at heading is typically the target sampling stage, it may not be feasible to sample large numbers of fields precisely at the same growth stage. Knowing the FLN change between Feekes stages 9 (ligule just visible), 10.5 (mid heading), and 11.5 (mid flowering) may be useful in interpreting FLN of samples collected either before or after heading. Information is needed on the flag leaf N response of hard spring wheat to growth stage, and other practices potentially affecting production and grain protein. Therefore the objectives of this study were to (1) examine the effects of planting dates and varieties on flag leaf N contents from full emergence to flowering in a replicated study, and (2) to monitor FLN changes in grower wheat fieldsin relation to reported critical FLN values. Methods Response to Variety and Planting Dates A three year field study was conducted on a Greenleaf silt loam (fine-silty, mixed, superactive, mesic, xeric calciargids) at the University of Idaho Parma Research and Extension Center to measure the flag leaf N response of three hard spring varieties (Vandal and WPB 936 hard reds, and ID377S hard white) grown under wide ranging planting dates (late fall, early spring, and late spring), with four late season N rates (0, 28, 56, and 84 kg ha-1) applied at heading. Factorial treatments were arranged in a randomized complete block with four replications. Planting dates ranged from 11-23 Nov for the late fall planting, 7-15 March for the early spring planting, and 10-14 April for the late spring planting. Urea N was topdressed each year to the entire experiment when the early spring planting was emerging (dates ranged from 23-30 March). Timing corresponded to the tillering stage for the late fall planting and preceded the late spring planting by 15 to 19 days. This N was dependent on rainfall for incorporation and significant rain in any year exceeding 5mm did not occur prior to the first irrigation on 23 April (1999), 24 April (2000), or 19 April (2001). The trial was irrigated each year with sprinklers. Flag leaves were collected only from treatments that did not receive late season N. The samples in the 2000 and 2001 seasons for each variety and planting date were collected at full flag leaf emergence (Feekes 9), mid-heading (Feekes10.5), and mid-flowering (Feekes11.5). Tissues were dried and ground and total N was determined by combustion analysis at the University of Idaho Analytical Services Laboratory. Treatment effects were evaluated with ANOVA and Regression options in SAS 8.0. Methods-continued Flag Leaf Monitoring of Producer Fields Flag leaves were collected at FEM, FHD, and FFL from 14 producer fields of irrigated hard red spring wheat in southwest Idaho and eastern Oregon over three seasons. Flag leaves were frozen or refrigerated until they could be oven dried, ground and submitted for total N (Kjeldahl) analysis at local commercial laboratories. Information from producers was obtained regarding the N fertilization practices used during the season. Head samples were collected from each field at late dough, the heads dried sufficient to thresh the grain, and the protein determined (12% moisture) by Kjeldahl. Grain protein of the harvested wheat was also obtained when available from the producer based on samples they submitted from storage to local elevators or distant FGIS facilities. However, harvest samples were not collected using the same sampling pattern as the flag leaves or late dough samples and in some cases were averages of several fields. Therefore, FLN was related to late dough protein because the sampling was more consistent.Late dough and harvest protein were linearly related (r2=0.78). Results Planting Date and Variety Effects on Flag Leaf N Planting dates significantly affected FLN, especially in 2000 (Fig. 1 ). FLN was highest for the late fall planting at each growth stage in the 2000 season and FLN for the late spring planting was lowest in two of three samplings. In contrast, FLN in 2001 did not differ as widely among planting dates as in 2000. FLN for the late fall planting in 2001 was lowest at FEM whereas the late spring planting was highest at FFL. Varieties differed significantly in FLN in 2000 with Vandal and WPB 936 averaging higher than ID377S at all growth stages . In contrast, WPB 936 FLN was higher than both Vandal and ID377S FLN in 2001. FLN averaged across all variety and planting date treatments in 2000 decreased 0.56%N from the first to last sampling. In contrast, FLN in 2001 decreased only 0.07%N from the first to last sampling. Flag Leaf N Monitoring in Producer Fields Producer fields sampled over the 1999-01 period are listed in Table 1 with their designations, late dough protein and N fertilization. Yields ranged from 6.05 to 8.54 Mg ha-1 (90-127 bu A-1) and protein from 12.6 to 17.4%. Only 5 of the 14 producer fields had late dough protein exceeding 14%despite late season N intervention (applied between boot and flowering stages) in all but two fields. Late season N (20-135 kg ha-1) was applied by various means; solutions through the lines, topdressed dry, foliar, and water run in furrows. Repeated applications were made in some fields. FLN values from the 2000 season are suspect as they fluctuated widely among growth stages. We find it unlikely that these fluctuations occur naturally within such short time periods. We suspect analytical difficulties in the commercial lab used and the FLN results from 2000 are not included in the following discussion. FLN at FEM ranged from 3.12 to 4.98%N in 1999 and 2001 grower fields. FLN in producer fields either increased, was unchanged, or decreased after FEM and the change was not related to the total late season N applied. Late N was, in some cases, applied in repeated applications throughout the period of sampling. The change in FLN from FEM to FHD ranged from a decrease of 0.52% N to an increase of 0.84% N over a period of time ranging from 3 to 10 days. The FLN change was unrelated to the number of days between samplings. FLN, with minimal mid or late season N applied (22-34 kg ha-1), decreased in producer fields at a daily rate ranging from 0.036 to 0.086% N. Summary Planting dates and varieties significantly affected FLN at specific growth stages. FLN monitoring across seasons in producer fields receiving late season N indicated that FLN was not consistently related to late dough protein. We found annual variability in the FLN-protein relation as well as the FLN change between growth stages. The influence of seasons, cultural practices, and other factors will make interpretation of FLN and it’s consistent use every year for predicting the need for protein enhancing late season N intervention difficult. Results -- continued FLN generally decreased in producer fields after heading with the exception of two fields where FLN slightly increased as a result of late season N > 112 kg N ha-1. The largest drop in FLN occurred in 1999 (decreases of 1.55 and 1.68% N) with minimal late season N applied. Of all samplings, FLN at FFL would be expected to be the most closely related to late dough protein, but there was no significant relation between them when the data from all years were included (data not shown ). Previously reported critical levels of 4.2-4.3% FLN at heading could not be supported from these limited data from commercial fields. Several fields had FLN at heading or later that exceeded the critical levels and yet late dough protein was 13% or less. FLN was a poor indicator of grain protein in producer fields when used on a commercial scale. References 1. Tindall, Terry A., Jeffrey C. Stark, and Randall H. Brooks. 1995. Irrigated spring wheat response to topdressed nitrogen as predicted by flag leaf nitrogen concentration. J. Prod. Agric. 8:46-52. 2. Westcott, Mal, Joyce Eckhoff, Rick Engel, Jeff Jacobsen, Grant Jackson, and Bob Stougaard. 1997. Rapid diagnosis of grain protein response to late-season nitrogen in irrigated spring wheat. Proceedings, Western Nutrient Management Conference. Salt Lake City, Utah. March 6-7. pp 77-81.


