Water Management Strategies and Environmental Impacts
This comprehensive guide explores water pollution sources, flows, and control policies, examining residential, commercial, agricultural, and industrial water usage. Learn about water conservation techniques, ownership rights, stream properties, and the effects of urbanization on water systems. Discover how water flows through various processes, storage mechanisms, and natural landscapes. Explore stormwater management methods, pollutants control, and wastewater treatment practices to protect water resources. Gain insights into permits for water and air pollutants and learn about the Clean Water Act principles. This informative resource provides valuable knowledge on water management practices to safeguard our environment.

Water Management Strategies and Environmental Impacts
E N D
Presentation Transcript
Water Pollutants Sources & Flows Control Policy
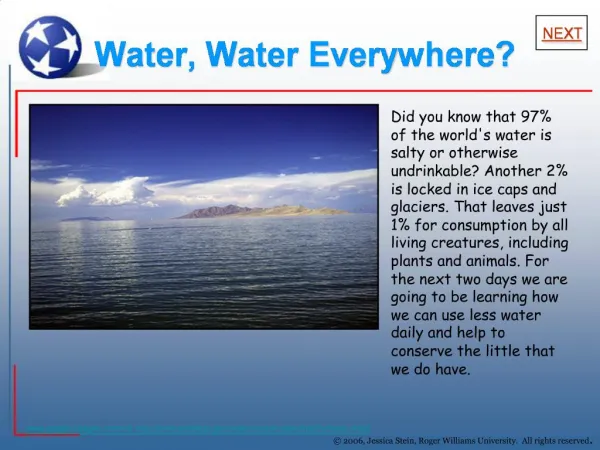
Ocean Clouds / Atmosphere Ice Caps / Frozen Groundwater Lakes & Rivers Total usable Freshwater 97% 0.001% 2% 0.65% 0.02% 0.03% (correct!) Where is the Water
Residential Commercial Agriculture Industry 80 billion-liters/day used 75% wasted 45 billion-liters/day used 60% wasted 500 billion liters/day used 40% wasted 545 billion-liters/day used 90% wasted Who Uses Water
How Do We Get More Water • Dams & Storage • benefits: cheap , clean power • costs: interruption of aquatic life cycles, sediment traps • Re-Use of ‘gray’ water • Conservation • eliminate leaks, low flow devices • natural landscaping • drip irrigation systems
Who Owns the Water • Prior Appropriation • western states of USA • first there, first served • Riparian Rights • English law, eastern USA • those bordering upon stream own it • quality of water concerns • ‘tragedy of the commons’ ???
Stream Properties • Meanders • Riffle / pool alternation • Shallow / deep alternation • Bend / straight watercourse • Channel winding moves gravel, rock, sand between sides of stream • Natural flow / speed reduction • Naturally prevents flooding
Hortonian Overland Flow Saturated Overland Flow Sub-surface Flow Ground Water Flow Strictly from urbanization and impervious surfaces Over grass, edges of stream banks during saturation of soils just under surface deep in the ground How Does Water Flow
Hortonian Overland Flow Saturated Overland Flow Sub-surface Flow Ground Water Flow Very fast, energy waves, destructive Can be destructive Recharges streams daily, percolation Recharges streams during drought, very slow movement water table shallow/deep What Does Flow Do
Rainfall • Evapo-transpiration • used by plants and respired as CO2 • Percolates into soil • Held by ‘capillary forces’ in soil pores • Slowly drains through capillary fringe into water table • Water table drains to streams, lakes, and aquifers
Natural Storage • Soil pores • increase porosity of soil, increase water retention • Worms, roots, macro-fauna dig about the soil increasing porosity • Leaf litter, logs, grass breaks energy of rain drops and slow water flow away • Aquifer: underlying impervious surface • water held in rock cavities, cracks, spaces • Aquiclude: • Impervious surface above & below
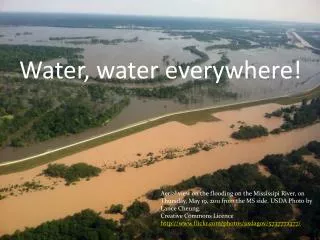
Stream Channel Depth, width, direction formed by bank full flow • Bank full flow is the highest energy event • Stream flows to height equal to the banks • Occurs on average once per year • Flooding over banks reduces energy as water spreads out, drops load & slows • Historic flood plain reflects past stream channels
Channelization • Straighten or pipe stream • Increases flow & velocity • Moves problems downstream • Increases flood potential downstream • Increases sediment load • Scours & removes benthos • bottom dwelling plants & organisms removed • depletes oxygen from water
Effects of Urbanization Storm Hydrograph • graphs volume of discharge against time • Decreased time lag from rain event to peak • Increased flow (volume) • Increased velocity (speed) • Increased scouring (destructive capacity)
Catch Basin Channelization Dikes Screening Wetlands Storage Tunnels CSO / SSO’s CDS Units Fills up, then washes out Takes problem downstream Same + increase speed Clogging & maintenance Space, climate Maintenance Health, bacteria Useful, but require cleaning Storm Water Control
Lowered curbs Percolation ponds Percolation gardens Riparian Buffer Zones (strips of green way beside river) Porous materials Grass swales / berms Safety issues Require space Good, but need to pick hardy plants Very good at reducing sediment & nutrients “Public perception” Soil & Plant dependent Storm Water Prevention
CSO design Combined Sewer Overflow or Out fall Combines storm water with wastewater (sewage) SSO design Sanitary Sewer Overflow or Out fall Wastewater & water from soaked ground Large pipe to stream Drop pipe to treatment plant diverts water during normal flow periods Infiltration of rainwater into cracks fills pipes Access lids pop-off allowing overflow Storm Water Treatment
Wastewater TreatmentSewage Treatment Plant • Primary Treatment • Screening & Settling Basins • Secondary Treatment • Biological Action to Remove Organics (SS) • Tertiary Treatment • Chemical Action to Remove Nutrients • Disinfection • Pathogen Removal
Permits for WATER polluters NPDES Point sources Storm Water Phase I Phase II NPS COPC’s CZMA Permits for AIR polluters NAAQS baseline, background levels Attainment Area’s areas that can assimilate more NSPS limits of pollutants from new sources Polluter Pays Principle
Clean Water ActYou have a permit to: • Discharge a certain quantity • Of a certain quality • Factors: • 85% BOD removed • 85% SS removed • Color, Odor • Metals, Toxicity • Bacteria, Pathogens • Chlorine residual • Temperature