Dynamic Causal Models
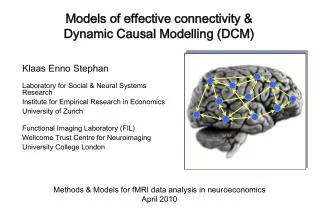
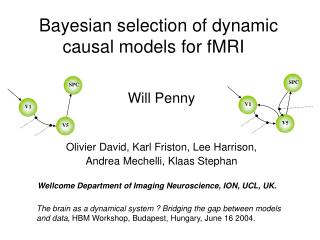
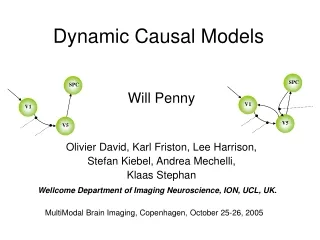
SPC. V1. V5. SPC. V1. V5. Dynamic Causal Models. Will Penny Olivier David, Karl Friston, Lee Harrison, Stefan Kiebel, Andrea Mechelli, Klaas Stephan. Wellcome Department of Imaging Neuroscience, ION, UCL, UK. MultiModal Brain Imaging, Copenhagen, October 25-26, 2005.

Dynamic Causal Models
E N D
Presentation Transcript
SPC V1 V5 SPC V1 V5 Dynamic Causal Models Will Penny Olivier David, Karl Friston, Lee Harrison, Stefan Kiebel, Andrea Mechelli, Klaas Stephan Wellcome Department of Imaging Neuroscience, ION, UCL, UK. MultiModal Brain Imaging, Copenhagen, October 25-26, 2005
Friston et al.(2003) Neuro- Image, 19 (4), pp. 1273-1302. Contents • Neurodynamic model • Hemodynamic model • Model estimation and comparison • Attention to visual motion
Contents • Neurodynamic model • Hemodynamic model • Model estimation and comparison • Attention to visual motion
Single region u1 c u1 a11 z1 u2 z1 z2
u1 c a11 z1 a21 z2 a22 Multiple regions u1 u2 z1 z2
Modulatory inputs u1 u2 c u1 a11 z1 u2 b21 z1 a21 z2 z2 a22
u1 u2 c u1 a11 z1 u2 b21 a12 z1 a21 z2 z2 a22 Reciprocal connections
Neuronal Activity Inputs Change in Neuronal Activity Input Connectivity Matrix Intrinsic Connectivity Matrix Modulatory Connectivity Matrices SPC V1 V5 Neurodynamics
Contents • Neurodynamic model • Hemodynamic model • Model estimation and comparison • Attention to visual motion • Single word processing
Hemodynamics For each region: Hemodynamic variables Dynamics Hemodynamic parameters Seconds
Why have explicit models for neurodynamics and hemodynamics ? For 4 event types u1, u2, u3, u4 : In a GLM for a single region, y=Xb+e, with 3 basis functions per event type (canonical,shifter, stretcher) there are 12 parameters to estimate. These relate hemodynamics directly to each stimulus. In a (single region) DCM there are 4 neuronal efficacy parameters relating neuronal activity to each stimulus And 5 hemodynamic parameters relating neuronal activity to the BOLD signal. A total of 9 parameters.
DCM Priors Hemodynamics Cov[h] E[h] Rate of signal decay: 0.65 Elimination rate: 0.41 Transit time: 0.98 Grubbs exponent: 0.32 Oxygenation fraction: 0.34 Neurodynamics Stability priors ensure principal Lyapunov exponent is less than zero with high probability.
Contents • Neurodynamic model • Hemodynamic model • Model estimation and comparison • Attention to visual motion • Single word processing
Bayesian Estimation Normal densities Relative Precision Weighting
Multiple parameters General Linear Model One-step if Ce, Cp and mp are known
Nonlinear models Current Estimates Linearization Friston et al.(2002) Neuro- Image, 16 (2), pp. 513-530. Gauss-Newton ascent with priors
SPC V1 V5 Model Comparison I Model, m Parameters: Prior Posterior Likelihood Evidence Laplace, AIC, BIC approximations Penny et al. (2004) NeuroImage, 22 (3), pp. 1157-1172. Model fit + complexity
Prior Posterior Likelihood SPC V1 V5 Model Comparison II Parameters: Model, m Parameter Parameter Model Model Evidence Prior Posterior
SPC V1 V5 SPC V1 V5 Model Comparison III Model, m=i Model Evidences: Bayes factor: Model, m=j 1 to 3: Weak 3 to 20: Positive 20 to 100: Strong >100: Very Strong
Contents • Neurodynamic model • Hemodynamic model • Bayesian estimation • Attention to visual motion • Single word processing
Attention to Visual Motion STIMULI 250 radially moving dots at 4.7 degrees/s PRE-SCANNING 5 x 30s trials with 5 speed changes (reducing to 1%) Task - detect change in radial velocity SCANNING(no speed changes) 6 normal subjects, 4 100 scan sessions; each session comprising 10 scans of 4 different condition Buchel et al. 1997 Experimental Factors • Photic • Motion • Attention
Model 1 Photic SPC V1 V5 Motion Att Specify regions of interest GLM analysis Identify regions of Interest eg. V1, V5, SPC
Model 1 Photic SPC V1 V5 Motion Att V1 V5 Estimation SPC Time (seconds)
g P(B321|y) B321 Posterior Inference How much attention (input 3) changes connection from V1 (region 1) to V5 (region(2)
Model 1 Photic SPC Very Strong V1 V5 Motion Att SPC V1 V5 B12 > 1019 Bayes Factor Model 2 Photic Motion Att
Model 1 Model 3 Photic SPC Photic SPC Positive V1 V1 Att V5 V5 Motion Motion Att Bayes Factor B13=3.6
Model 1 Photic SPC SPC Weak V1 V1 V5 V5 Motion Att Penny et al. (2004) NeuroImage, Special Issue. B14=2.8 Bayes Factor Model 4 Photic Att Motion Att
Summary • Neurodynamic model • Hemodynamic model • Bayesian estimation • Attention to visual motion