
Comprehensive Analysis of Zinc Plant Flowsheets for Optimal Separation Techniques
This document provides an in-depth analysis of various flowsheets used in zinc processing plants, particularly focusing on the SOMINCOR flowsheet. Key components such as input data, calculated parameters, and local/global balances are examined. Detailed equations demonstrate yield and recovery metrics, illustrating the effectiveness of separation processes. By analyzing upgrading curves and separation efficiency across different nodes, the report concludes that ideal separation is achievable with optimal conditions. The insights presented can guide enhancements in zinc flotation operations, leading to improved recovery rates and efficiency.

Comprehensive Analysis of Zinc Plant Flowsheets for Optimal Separation Techniques
E N D
Presentation Transcript
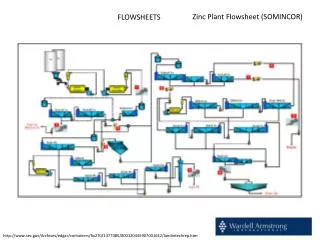
Zinc Plant Flowsheet (SOMINCOR) FLOWSHEETS http://www.sec.gov/Archives/edgar/containers/fix270/1377085/000120445907001642/lundintechrep.htm
Analysis of flowsheets SIMPLE CASE finaltailing finalconcentrate
Balance of eachnode GRADE – content of a component in feed %, – content of a component in concentrate, %, – content of a component in combined products, %, – content of a component in tailing, % Input data inputparameters: α, , calculatedparameteres: , , r, a… – yield of a product , % – recoveryof a considered component in a product, % r– recoveryof otherthanconsideredcomponents in anotherproduct, % *, and r calculated from α,, semiproduct P1 feed α concetrate tailing concentrate C1 concentrate C2
EQUATIONS (%) (%) (%) (-) a = 100 idealseparation , a ~ 1000 no separation
feed product grade ,% F 1.421 100.0 100.0 yield,% recov., % 1 P1 15.25 P2 0.2185 8.00 85.85 92.00 14.15 2 3 C2 7.000 T 0.150 C1 29.00 C3 0.60 62.50 28.69 84.8458.20 37.5071.31 15.2241.80 tailing T concentrate C3 concentrate C2 concentrate C1 Flowsheet with balances of nodes (localbalances)
Upgradingcurves for nodesusinglocalbalances conclusion: separationisbest in node 1 (a=101.30 and worse in nodes 2 and 3, a=~125)
Best flotation results upgrading curve EQUATIONS weightedaverage for instance for products C1+C2
Feed 1 semiproduct P2 semiproduct P1 concentrate C1 2 3 concentrate C2 tailing T concentrate C3 4 final concentrate Cf final tailing T f Options of industrialflowsheet
Feed Feed 1 semiproduct P2 semiproduct P1 1 semiproduct P2 semiproduct P1 concentrate C1 2 3 concentrate C2 tailing T concentrate C3 2 3 5 final concentrate C final tailing T 4 f f final concentrate C final tailing T f f = =
Feed 1 semiproduct P2 semiproduct P1 concentrate C1 2 3 concentrate C2 tailing T concentrate C3 4 final concentrate C final tailing T f f
Feed 1 semiproduct P2 semiproduct P1 concentrate C1 2 3 concentrate C2 tailing T concentrate C3 5 4 final concentrate C final tailing T f f
Feed 1 semiproduct P2 semiproduct P1 concentrate C1 2 3 concentrate C2 tailing T concentrate C3 4 final concentrate C final tailing T f f
Selectivity of separation for differentoptions of composition of finalflotation products =
Selection of optimum point of process commonsense optimum point of separation example of point of optimum separationbased on economics Finaldecision: Cf=C1+C2 + somethingdepending on criterion of upgradingoptimal point
Transformation of the Fuerstenau(recovery-recoveryor-)upgradingcurveinto Halbich (grade-recoveryorβ- ) upgradingcurve the Fuerstenau (-)is alfa -insensitiveequivalent of the Halbich (β- ) upgradingcurve
Flowsheet with balance of nodes (localbalances) inputparameters: α, ,
EQUATIONS Recyclenode (1) Separatingnodes (%) (%) (%) (-) a = 100 idealseparation , a ~ 1000 no separation
node l g S g e S e e 2 r 0,00 0,00 100,00 25,00 0,89 0,89 28,40 28,40 99,33 0,57 99,11 100,00 71,60 100,00 0,00 0,78 l g S g e S e e 4 r 0,00 0,00 100,00 25,00 11,76 11,76 52,63 52,63 90,65 3,00 88,24 100,00 47,37 100,00 0,00 5,59 l g S g e S e e 5 r 0,00 0,00 100,00 0,60 78,48 78,48 83,30 83,30 21,55 0,44 21,52 100,00 16,70 100,00 0,00 0,57
Upgradingcurves for nodesusinglocalbalances node 5 is not efficient
Global balance of flowsheet(feed F2 is 100%) knownparameters: α, , Eqs for recycling nodes
Calculations Feed 1: gradesareknown, G and Gareequal to 100% Node 1 Gradesareknown, local and for F1 areknown (=21.95%) (for C3 is 100- 21.95 =78.05%) orcan be calculated from grades of products Calculation of global for F2 Q) How largeis for C3 when for F1 is 100%? A) WhenF1=100%, C3 =(100/21.95)x 78.05= 350%. Then F2= F1+C3 = 100+350=450%
Graphicalrepresentation of separation data (not veryuseful, recoveriesgreaterthan 100%) Grade –recoverycurve for Pb, Cu and Zn circuitswithin the Eureka Concentrator (based on Ch. Greet, Spectrum Series, 2010)
The Eureka Mine – An Example of How to Identify andSolve Problems in a Flotation Plant Christopher Greet
Usefulliterature The Eureka Mine – An Example of How to Identify andSolve Problems in a Flotation Plant Christopher Greet
Homework Createyourownflowsheet and calculatelocal and globalbalanses as well as plot graphswhichwillhelpyou to evaluate the plant performance