EBA Customs Index: Assessing Customs Procedures for Businesses
The EBA Customs Index evaluates customs procedures with data from expert surveys among EBA members. Factors include customs clearance time, inspection share, paperwork amount, and more. The report, segmented by company size, provides insights and trends in customs processes. Conducted by EBA and InMind research company in 2013, the index covers the 2nd half of 2012. Results show the overall customs index values and components for businesses to assess their customs experience.

EBA Customs Index: Assessing Customs Procedures for Businesses
E N D
Presentation Transcript
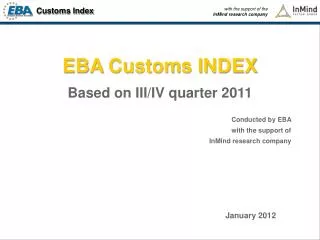
EBA Customs INDEX Based on results of III/IV quarters of 2012 Conducted by EBA with support of InMind research company February 2013
Project Design The represented results of EBA Customs Index are based on data of expert survey conducted among EBAmembers. EBA Customs Index It represents evaluation of 5 factors characterizing customs procedures, being undergone by companies while interacting with customs. Calculation of the customs index is based on weighted means of each factor. Factors and weight coefficients • Evaluation of procedures of customs clearance of one supply (25%) duration of customs clearance of one supply(12,5%) share of goods chosen for physical inspection (10%) share of goods, classification code of which has been changed by customs authorities (2,5%) • Evaluation of customs value identification procedure (25%) • Amount of paperwork (25%) • Number (5%) and duration (5%) of inspections • Professional level of customs authorities (15%) Additional information In addition to expert evaluation of factors, survey includes measures of each factor indexes de-facto. As additional information for customs procedures the survey also regarded: • Usage of electronic declaration practice • Evaluation of change in corruption level of customs authorities • Evaluation of usage practice of the new Customs Code
The report is structured by information regarding each factor and contains the following data: Measures of central tendencies of expert evaluations of each factor (mean and median) Distribution of expert evaluations of each factor by 5-point scale Mean values of indexes characterizing each factor (in dynamics) The results are also segmented by company size:small/medium and big business Report Comment The results are based on data of the 5th wave of expert survey regarding real experience of companies. The expert evaluations of factors characterizing customs procedures and calculation of the integral index are conducted for the first time. Participants: 52 representatives of EBA companies-members and participants of the Customs Committee Timeframes: data collected in February 2013 and reflect the situation of the 2nd half 2012 Conducted:The research is conducted by EBA, analytical support: InMind research company
Overall results: customs index 1 – minimum/negative index value 3– average/neutral index value 4– maximum/positive index value Scale from 1 to 5, where:
EBA Customs INDEX: Components
Duration of customs clearance of one supply Scale from 1 to 5, where: 1– minimum/negative index value 3– average/neutral index value 5 – maximum/positive index value Average Index of duration of customs clearance of one supply Averagenumber of days, spent on customs clearance of one supply: from the moment of the border control start to the moment of customs clearance finish in the destination customs Average number of hours, spent on authorization of one customs declaration: from the moment of application of customs declaration to a customs authority to the moment of its authorization completed HALF OF THE YEAR Results by detailed scale of the index (from 1 to 5) Negative value Positive value Duration of customs clearance of one supply is completely reasonable and acceptable for our company Duration of customs clearance of one supply is NOT reasonable and NOT acceptable for our company
Share of goods chosen for physical inspections Average Index of reasonability of share of goods chosen for physical inspection Scale from 1 to 5, where: 1 – minimum/negative index value 3 – average/neutral index value 5 – maximum/positive index value • Average share of goods chosen for physical inspection • Comparing to total number of supplies in %: number of physical inspections / total number of supplies* 100% HALF OF THE YEAR Results by detailed scale of the index (from 1 to 5) Negative value Positive value The share of goods chosen for physical inspection is NOT reasonable regarding the total number of supplies in our company The share of goods chosen for physical inspection is completely reasonable regarding the total number of supplies in our company
Share of goods, classification code of which has been changed Average Index of customs classification conclusion Scale from 1 to 5, where: 1 – minimum/negative index value 3 – average/neutral index value 5 – maximum/positive index value Average share of goods, classification code of which has been changed by customs authorities, comparing to the total number of goods (%): number of goods, classification code of which has been changed / total number of goods * 100 HALF OF THE YEAR Results by detailed scale of the index (from 1 to 5) Negative value Positive value In majority of cases I agree with the customs classification conclusion In majority of cases I DO NOT agree with the customs classification conclusion
Customs value Scale from 1 to 5, where: 1 – minimum/negative index value 3 – average/neutral index value 5 – maximum/positive index value Average Index of reasonability of refusals to acknowledge the customs value • Average number of customs authority refusals to apply the first method for identification of the customs value • (i.e. by agreed value, share of total number of custom declarations) HALF OF THE YEAR Results by detailed scale of the index (from 1 to 5) Occurrences of unreasonable refusals to acknowledge the customs value are systematic (more than 4 times a month) Negative value Positive value There are no occurrences of unreasonable refusals to acknowledge the customs value, or such occurrences are sporadic Yes, 27% No, 65% • Did you receive any written explanations of the reasons for refusal to apply the first method? • Has it ever happened that custom authorities invoked using indicative prices without application of methods 2-5?
Amount of paperwork Scale from 1 to 5, where: 1 – minimum/negative index value 3 – average/neutral index value 5 – maximum/positive index value Average Index of paperwork onerousness for company business-processes • Average number of documents, application of which to customs authority and other inspections was demanded for customs clearance of one supply: • (sanitary, phytosanitary, epidemiological, etc.) HALF OF THE YEAR Results by detailed scale of the index (from 1 to 5) Negative value Positive value The number of documents is reasonable and NOT oppressive for business-processes The number of documents is large and oppressive for business-processes
Checks Scale from 1 to 5, where: 1 – minimum/negative index value 3 – average/neutral index value 5 – maximum/positive index value Average Index of number and duration of inspections • Average share of companies, which have experienced inspections after customs clearance is completed Average duration of customs inspection:number of days HALF OF THE YEAR
Professional level of customs authorities Average Index of professional level of customs authorities Scale from 1 to 5, where: 1 – minimum/negative index value 3 – average/neutral index value 5 – maximum/positive index value HALF OF THE YEAR Results by detailed scale of the index (from 1 to 5) Negative value Positive value Customs authorities mainly own high level of professionalism Professional level of customs authorities is mostly low
EBA Customs INDEX: Additional results
Electronic declaration • Does your company use electronic customs declarations/electronic pre-alert declarations in its business activity? No Yes (+40%) • Average share of pre-alert declarations, which are applied electronically • Average share of customs declarations, which are applied electronically 92% (+14%) 78% (+44%) Electronic declaring doesn’t lead to simplification and acceleration of the cargo customs clearance process Negative value Positive value Electronic declaring really simplifies and accelerates the cargo customs clearance process
Corruption level • From your point of view, during the last 6 months, corruption in customs authorities: Decreased – 27% (+2%) Increased – 13% (-3%)
The New Customs Code • Is adoption of new edition of the Customs Code a positive event for your company?
Changes of the Customs Code in use In order of loss of usage frequency : Simplified electronic declaration Choosing Customs: Customs clearance of goods beyond the place of registration Confirmation of customs value 4 hours for customs clearance
Changes of the new Customs Code which still remain inaccessible In order of loss of usage frequency: Customs evaluation with the use of the 1st method, automatic evaluation AEO status Return of extra customs payments from the budget Impossibility to declare goods without them entering the customs territory of Ukraine Declaration of goods with the use of a previous declaration Clearance of a large nomenclature of goods by one code,temporary declaration 4 hours spent for the customs clearance Customs clearance out of the accreditation place
+38 044 496 06 01 office@eba.com.ua www.eba.com.ua