Download
1 / 26
260 likes | 350 Vues
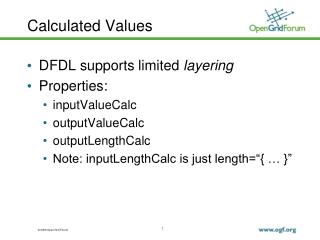
The RECOORD Database project aims to recalculate protein structures using NMR restraints to reduce biases and enhance interstructure comparisons. The project provides a database for validation tool development and offers consistent STAR files, coordinates, and restraints. Issues with data conversion and topology building are addressed, with quality indicators evaluated for CNS and CYANA refinements. The project explores correlations between refined and original structures, focusing on improvement in packing and Ramachandran Z-scores.

E N D
RECOORDREcalculated COORdinates Database Jurgen Doreleijers Center for Eukaryotic Structural Genomics University of Madison-Wisconsin jurgen@bmrb.wisc.edu Aart Nederveen Bijvoet Center for Biomolecular Research Utrecht University a.j.nederveen@chem.uu.nl Wim Vranken Macromolecular Structure Database European Bioinformatics Institute wim@ebi.ac.uk
Aim • Recalculation of protein structures based on deposited NMR restraints using state of the art methods • Goals: • decrease user- and software-dependent biases • allow a bettercomparison between structures • comparison between different structure calculation programs • provide a database for the development and assessments of validation tools and calculation protocols
Overview recalculation project EBI/UU: Generation of consistent STAR files PDB: -coordinates -restraints BMRB: STAR files Doreleijers et al. 2003 2 3 1 restraint manipulation CNS -topology -MD SA -refinement CYANA -sequence -MD SA -… 5 4 recalculation design of RECOORD 6 analysis analysis -improvement? -correlations? -…
Databases now publicly available • DOCR/FRED (BMRB) databases containing converted and filtered restraints http://www.bmrb.wisc.edu/servlets/MRGridServlet • RECOORD (EBI) database containing recalculated coordinates http://www.ebi.ac.uk/msd/recoord
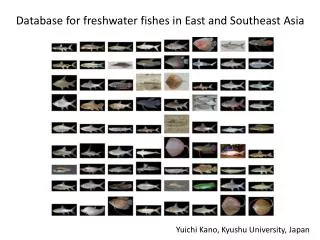
PDB: -coordinates -restraints BMRB: STAR files Doreleijers et al. 2003 2 1 Selection • Formats (if distance restraints available): • CNS/XPLOR • DIANA/DYANA/CYANA • DISCOVER/MSI • PDB entries selected: • only proteins • no HET atoms • multimers allowed (not yet re-calculated) • at least 20 residues • Finally 545 monomers were selected
EBI/UU: Generation of consistent STAR files 3 Conversion issues • Data is converted to formats readable by calculation software (e.g. XPLOR/CNS and CYANA) by the FormatConverter available within CCPN software (Wim Vranken, EBI). Problems: • Differences between coordinate and restraint data: • e.g. 1 chain in pdb entry, 2 chains in restraint list • residue numbering can differ in PDB entry and restraint list • restraints for residues not present in PDB entry… • Nomenclature in restraint list
CNS -topology -MD SA -refinement CYANA -sequence -MD SA -… 5 4 Building topology • Starting script: generate_easy.inp from CNS • Automated detection in original ensemble of: • Disulfide bridges (<3Å S-S distance in original first models) • CIS peptides (if |w|<25º in original first models) • Protonation state of histidines (use CNS patches HISD, HISE) • CYANA: sequence based on CNS topology • Add CYSS, HIST, HIST+, cPRO in sequence • Automated generation of disulfide restraints
CNS -topology -MD SA -refinement CYANA -sequence -MD SA -… 5 4 CONDOR computer cluster CS University Madison • More than 800 processor used • Total CPU time: 31,169 hours (3.5 years on single workstation) • Example 2EZM, calculation of 1 model (101 a.a. & 2.2 GHz P4 computer) CYANA 31 seconds CNS 340 seconds
6 analysis -improvement? -correlations? -… Evaluation of structure quality • Agreement with experimental restraints • Improvement? • Comparison CNS and CYANA • Relation NMR data quality and structural quality
6 analysis -improvement? -correlations? -… Distance restraints violations ORG: 0.08 Å (0.14 Å) original entries CNW: 0.04 Å (0.05 Å) recalculated in CNS and refined in water frequency RMS distance restraints violations (Å)
6 analysis -improvement? -correlations? -… Dihedral restraints violations ORG: 1.6° (4.6°) original entries CNW: 0.5° (0.5°) recalculated in CNS and refined in water frequency RMS dihedral restraints violations (degrees)
6 analysis -improvement? -correlations? -… Results: quality indicatorsperformance CNS vs. CYANA (no water refinement yet)
6 analysis -improvement? -correlations? -… Results: quality indicatorsperformance CNS before and after water refinement
6 analysis -improvement? -correlations? -… Improvement: packing and Ramachandran Z-scores Improvent Z-score: DZ=Zrefined - Zoriginal For ~ 5 % of entries no improvement possible because of missing NMR data compared to authors improvement Ramachandran missing data improvement packing
6 analysis -improvement? -correlations? -… In search of correlations (Pearson coefficient) refined (correlations higher) original (correlations lower)
6 analysis -improvement? -correlations? -… In search of correlations (Bumps) refined original
6 analysis -improvement? -correlations? -… In search of correlations (NMR data density) refined original
6 analysis -improvement? -correlations? -… Correlation NMR data density Ramachandran Z-score r=0.31 Ramachandran Z-score NMR data density
6 analysis -improvement? -correlations? -… Correlation NOE completeness and packing Z-score r=0.20 NMR data-based indicators cannot yield any indication of the normality of the structures packing Z-score NOE completeness
6 analysis -improvement? -correlations? -… In search of correlations (Precision) refined original
6 analysis -improvement? -correlations? -… Correlation between precision and data density r=-0.46 circular variance NMR data density
6 analysis -improvement? -correlations? -… Correlation between precision and Ramachandran r=-0.67 Protein with high Ramachandran normality will have small circular variance circular variance 1SUT Ramachandran plot appearance (Z-score)
6 analysis -improvement? -correlations? -… Correlation between RMSD and structural uncertainty (QUEEN) r=-0.69 Structural uncertainty imposes lower limit to the RMSD backbone RMSD (Å) structural uncertainty
Conclusions I • NMR-STAR files made consistent for 545 out of ±1700 entries • Protocols and scripts available for recalculation in CYANA and CNS • Validation database available for testing of new protocols • Improvement compared to original data: 1 standard deviation closer to X-ray db • violations in original data do no limit recalculation effort • refinement in water required • 5 % no improvement: data missing
Conclusions II • Correlations higher after recalculation and refinement, though most of them still weak • Highest correlation: precision vs. Ramachandran score & structural uncertainty (QUEEN)
Acknowledgements • Utrecht University Alexandre Bonvin Rob Kaptein • EBI Cambridge Wim Vranken • CESG/BMRB Jurgen Doreleijers Zachary Miller Eldon Ulrich John Markley • Radboud University Nijmegen Chris Spronk Sander Nabuurs • RIKEN Japan Peter Güntert • Institut Pasteur Paris Michael Nilges