TETRIS
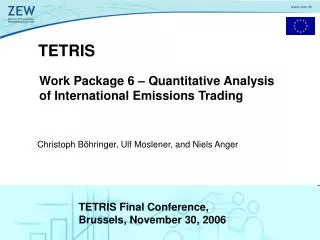
TETRIS. WP6 – Quantitative Analysis of International Emissions Trading and Linkages between Workpackages. Christoph Böhringer, Ulf Moslener and Niels Anger. Presentation for Project Meeting, Amsterdam, June 21, 2006. WP6: Structure of the Presentation. PART I: Modelling concept of WP6.

TETRIS
E N D
Presentation Transcript
TETRIS WP6 – Quantitative Analysis of International Emissions Trading and Linkages between Workpackages Christoph Böhringer, Ulf Moslener and Niels Anger Presentation for Project Meeting, Amsterdam, June 21, 2006
WP6: Structure of the Presentation PART I: Modelling concept of WP6 PART II: Linkages between workpackages
WP6: Objectives • Extend existing CGE model of international trade and energy use with a concrete representation of the EU ETS • Integrate project-based JI and CDM within top-down framework accounting for • Transaction costs • CDM-specific investment risks • Technology transfer Workpackage leader: • ZEW • Ecoplan • CCAP • ECN • NTE Workpackage participants:
WP6: Workplan • EU ETS analysis • National allocation plans (NAPs): EU-25 (country level) • Complementary EU policies (taxes) for non-ETS sectors • Update of data base: GTAP-6, IEA/DOE energy outlooks • Simulation of economic and emission impacts (based on CGE analysis) • Extensions • Explicit bottom-up CDM/JI supply curves (cost-potential) • Bottom-up (technology-specific) transaction costs • CDM Investment risk indicator • Technology transfer completed in progress
MAC Complementary MAC incorporation Partial equilibrium: SIMAC General equilibrium: PACE Implicit CDM supply curves Explicit CDM supply curves based on BU abatement Macro impacts except for CDM host countries Macro impacts also for CDM host countries • Explicit MACs based on BU or TD approach • Discrete step function or continously differentiable functional form (fit), e.g.: • Direct impacts (carbon market only) • Regional compliance costs • Strengths: transparency, communication • Direct + indirect (macro) impacts • Strengths: Comprehensiveness, • (market interactions, income)
PACE: CDM Technology Transfer Variant 1: Variant 2 (optional): • Analogous modelling of CDM and emissions trading. Model does not explicitly capture: • CDM induced technology changes • CDM-specific investment flows between host and donor Emissions trading CDM CER transfer and technology transfer AAU transfer Choice of trading regions and sectors (r, i): Alternative sectoral coverage for CDM host countries (restricted vs. unlimited)
Assessment of Technology Transfer • A) Bottom-up approach 2-/3-step procedure (PE&GE): • Determine equilibrium carbon prices in model analysis (WP6) • Deduce transferred technologies from bottom-up CDM supply curves and database (WP3) • Determine investment flows from donor to host country (WP3+WP6) • Technology-based approach • B) Top-down approach – optional (GE only): • Multi-regional CGE model • Non-project based CDM for regions and sectors to be specified • Modelling of efficiency improvements in the electricity sector • Macroeconomic aspects of technology transfer
Transaction costs and investment risk • Transaction costs: • Project based transaction costs (WP3) • Upward shift of CDM supply curve • Modelling: Premium on CER price • Investment risk specific to CDM: • Composite investment risk indicator CPI (WP1) • Risk premium on CER price • Upward shift of CDM supply curve (risk lowers expected return of CDM projects)
Model Inputs • CDM supply: • Project-based abatement cost data (CDM) (WP3) • Project-based technology data (WP3,WP2) • Project-based transaction costs (WP3) • CDM investment risk: • Country-specific risk indicator (WP1) • Emissions data Eastern Europe: • Emission projections (WP5)
Participants: ZEW, Ecoplan, ECN, Natsource, CCAP Mapping 1: Countries (regions) CDM risk indicator Mapping 2: CDM projects Abatement potential & price Country Sector Technology Transaction costs Investment volume (?) WP6 Linkage Phase
Linkages to other WP WP 1: Investment risk Composite indicator (CPI) Transformation to risk premium scale WP 2: Technology transfer Case studies: Real world experience • WP 3: Permit supply • MAC curves by region and sector w/wo transaction costs • Technology transfer: Step 2 and 3 WP 5: JI and ET in Eastern Europe Emissions data
Good luck Oranje! Good luck Oranje! Presentation for Project Meeting, Amsterdam, June 21, 2006
Partial Equilibrium: The Model • SIMAC : SImulation Model based on Marginal Abatement Costs Böhringer et al. (2005) • Numerical multi-country partial equilibrium model of the (world) carbon market in 2010 and 2020 • Objective: Minimization of compliance (abatement) costs by emissions trading • Model may covers transaction costs and investment risk for CDM projects • Based on (calibrated) marginal abatement cost functions for energy-intensive and non-energy-intensive sectors EU-ETS • MACs can be based on bottom-up (e.g. POLES energy system model) or top-down model (e.g. PACE – CGE model)
General Equilibrium: The Model PACE PACE (Policy Assessment based on Computable Equilibrium): • Multi-sector, multi-region model of the EU (updated data base: GTAP 6) • Incorporation of market interactions and income closures • Micro-consistent calibration based on empirical data for technologies and consumer preferences
Channels of international technology transfer • TT through foreign direct investment – Channels: imitation effects, labor turnover and vertical linkages of firms (Saggi 2000) • TT as international knowledge spillovers by international capital flows • induced technological change (Kemfert 2002) 3. TT as knowledge transfer through trade in goods (Grossman and Helpman 1991) • “Embodiment hypothesis”: technology is embodied in commodities • knowledge is transferred through trade • Knowledge spillovers embodied in final goods (Das 2000) • Knowledge spillovers embodied in intermediate inputs (Das 2002)