1 / 1

(a) Q-PCR GSC standard curve

(a) Q-PCR GSC standard curve. Ct = -5.136 x log(C’) + 31.083 (R 2 = 0.9837) * C’ = 10 ^ ((Ct-31.083)/(-5.136)). Ct value. log(C’) C’=copy number per cell in sample homogenate. (b) GeneChip GSC standard curve. log(S) S=GeneChip signal intensity. log(S) = 0.9846 x log(C’) + 1.2353

tameka
Télécharger la présentation

(a) Q-PCR GSC standard curve

An Image/Link below is provided (as is) to download presentation Download Policy: Content on the Website is provided to you AS IS for your information and personal use and may not be sold / licensed / shared on other websites without getting consent from its author. Content is provided to you AS IS for your information and personal use only. Download presentation by click this link. While downloading, if for some reason you are not able to download a presentation, the publisher may have deleted the file from their server. During download, if you can't get a presentation, the file might be deleted by the publisher.

E N D

Presentation Transcript


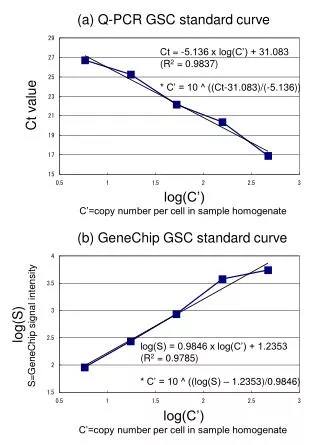
  1. (a) Q-PCR GSC standard curve Ct = -5.136 x log(C’) + 31.083 (R2 = 0.9837) * C’ = 10 ^ ((Ct-31.083)/(-5.136)) Ct value log(C’) C’=copy number per cell in sample homogenate (b) GeneChip GSC standard curve log(S) S=GeneChip signal intensity log(S) = 0.9846 x log(C’) + 1.2353 (R2 = 0.9785) * C’ = 10 ^ ((log(S) – 1.2353)/0.9846) log(C’) C’=copy number per cell in sample homogenate

More Related