Download
1 / 28
280 likes | 383 Vues
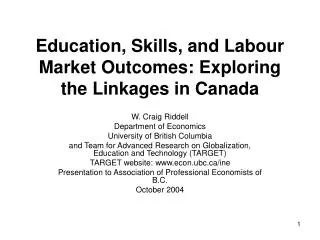
Labour, education and skills: Building a clever Australia. Barry McGaw Melbourne Graduate School of Education, University of Melbourne Chair, Australian Curriculum, Assessment and Reporting Authority. Sydney, 15 Sep 2010.

E N D
Labour, education and skills: Building a clever Australia Barry McGawMelbourne Graduate School of Education, University of MelbourneChair, Australian Curriculum, Assessment and Reporting Authority Sydney, 15 Sep 2010 Natstats 2010 – Measuring what counts: Economic development, wellbeing and progress
Outline of presentation • International indicators of educational performance • Quality • Equity • Improving Australian educational performance • Contribution of reform • Contribution of indicators • Role of the My School website • Minimising risk of perverse impact of indicators
Mean reading results (PISA 2000) Australia tied for 2nd with 8 othersamong 42 countries. OECD (2003), Literacy skills for the world of tomorrow: Further results from PISA 2000, Fig. 2.5, p.76.
Australia’s ranking in OECD/PISA Reading PISA 2003 PISA 2000 PISA 2006 Finland FinlandKoreaCanadaNZHong Kong Finland Ahead of Australia KoreaCanadaNZHong Kong KoreaCanadaNZ Same as Australia Hong Kong Behind Australia • Reading ranks • PISA 2000: 4th but tied for 2nd • PISA 2003: 4th but tied for 2nd • PISA 2006: 7th but tied for 6th
Trends in reading performance Korea Finland Hong Kong Canada New Zealand Australia Poland
Trends in Australian reading performances 95th %ile 90th %ile 75th %ile Mean 25th %ile 10th %ile 5th %ile OECD (2007), PISA 2006: science competencies for tomorrow’s world, Vol. 1 - analysis, Fig. 6.21, p.319.
Social gradients for science (PISA 2006) High quality High equity High quality Low equity Low quality Low equity Low quality High equity OECD (2007) PISA 2006: science competencies for tomorrow’s world, Vol 1 – analysis, Figure 4.6, p.184.
SES-science correlations (PISA 2006) High quality High equity High quality Low equity Low quality Low equity Low quality High equity OECD (2007) PISA 2006: science competencies for tomorrow’s world, Vol 1 – analysis, Figure 4.6, p.184.
Variation in reading performance (PISA 2000) Variation of performance within schools Variation of performance between schools OECD, UNESCO (2003), Literacy skills for tomorrow’s world: further results from PISA 2000, Table 7.1a, p.357.
Variation in reading performance (PISA 2000) Variation of performance within schools 68% 32% Variation explained by social background of students Variation not explained by social background of students OECD, UNESCO (2003), Literacy skills for tomorrow’s world: further results from PISA 2000, Table 7.1a, p.357.
The storyline so far… • Messages from international indicators • Quality is high in Australian schools • Equity is relatively low & schools contribute to this
Improving Australia’s educational performance • Contribution of reform • National curriculum • Teacher and school development • Contribution of indicators • National Assessment Program (NAP) • Sample-based surveys • Science • ICT Literacy • Civics and citizenship • Full-cohort assessments • Literacy and Numeracy (NAPLAN) • My School website
There is a very clever and clear display being proposed for 2010 in place of the one in the previous slide.
The storyline so far… • Messages from international indicators • Quality is high in Australian schools • Equity is relatively low & schools contribute to this • Improving Australian education • Curriculum reform • Defining clear learning entitlements • Setting high expectations for all • Teacher development • Use of ‘fair’ comparisons among schools • Learning from others doing better in similar circumstances
Minimising risk of perverse consequences • Ensuring appropriateness of NAPLAN tests • Preparing students for tests • Ensuring familiarity is all that practice can add • Literacy and numeracy are developed in full curriculum • Broadening the literacy and numeracy tests • Test a broader range of content and skills • Have different students take different tests • Curriculum provides public declaration of students’ full learning entitlements • Ensuring appropriateness of like-school comparisons • Socio-educational advantage without ecological fallacy • Taking account of special sub-populations in schools
The full storyline • Messages from international indicators • Quality is high in Australian schools • Equity is relatively low & schools contribute to this • Improving Australian education • Curriculum reform • Defining clear learning entitlements • Setting high expectations for all • Teacher development • Use of ‘fair’ comparisons among schools • Learning from others doing better in similar circumstances • Balancing benefits and risks of indicators