Download
1 / 40
400 likes | 558 Vues
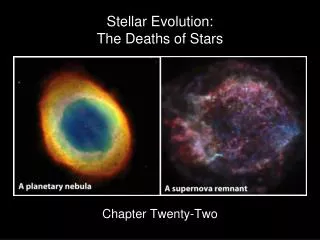
From Pre-stellar Cores to Proto-stars: The Initial Conditions of Star Formation. PHILIPPE ANDRE DEREK WARD-THOMPSON MARY BARSONY Reported by Fang Xiong , PMO. Authors. Philippe Andre Research Projects: Early Stage of star formation. Mary Barsony

E N D
From Pre-stellar Cores to Proto-stars:The Initial Conditions of Star Formation PHILIPPE ANDRE DEREK WARD-THOMPSON MARY BARSONY Reported by Fang Xiong, PMO
Authors Philippe Andre Research Projects: Early Stage of star formation. Mary Barsony Research Projects: Spitzer IRS (Infrared Spectrometer) imaging of the outflow driven by the nearest, well-isolated protostar. Derek Ward-Thompson Research Interests: The very earliest stages of star formation, including pre-stellar cores.
OUTLINE • I. Introduction • II. Pre-Stellar Cores • III. The Youngest Proto-stars • IV. Summary
I. INTRODUCTION • The formation of low-mass stars is believed to involve a series of different stages. • The first stage: Fragmentation of a molecular cloud into a number of gravitationally-bound cores. Thermal Pressure Gravity = Magnetic Pressure Turbulent Pressure
I. INTRODUCTION • The second stage: Thepre-stellar fragment becomes gravitationally unstable and collapses, the released gravitational energy radiates away and the fragment stays roughly isothermal. • Then, an opaque, hydrostatic proto-stellar object forms in the center. • The third stage: The central object builds up its mass from a surrounding infallingenvelope and accretion disk, while progressively warming up.
I. INTRODUCTION • Standard collapsing theory: Larson: Runaway Model, “outside first, then inside”. Shu: Inside-out Model, “inside first, then outside”. • Both Larson and Shu’s model reqiue isothermal condition. • Observations have shown that the accretion phase is always accompanied by a powerful bipolar outflows.
CONTENT • I. Introduction • II. Pre-Stellar Cores • III. The Youngest Proto-stars • IV. Summary
II. PRE-STELLAR CORES • A. Definition and Identification • B. Spectral Energy Distributions and Temperatures • C. Mass and Density Structure • D. Lifetimes
II. PRE-STELLAR CORESA. Definition and Identification • In 1980s, Myers and co-workers catalogued about 90 cores by transitions of NH3. • These cores were separated into starless cores and cores with stars according to whether an embedded source was detected by IRAS or not. • The starless NH3 were the potential sites of future isolated low-mass star formation.
II. PRE-STELLAR CORESA. Definition and Identification • In 1994, Ward-Thompson observed the 800μm dust continuum emission of about 20 starless NH3cores from the Myers’s list. • They found these starless cores have larger FWHM sizes than, but comparable masses to the envelopes of the youngest proto-stars. • They alsodemonstrated that pre-stellar cores have flat inner radial density profiles.
II. PRE-STELLAR CORES • A. Definition and Identification • B. Spectral Energy Distributions and Temperatures • C. Mass and Density Structure • D. Lifetimes
II. PRE-STELLAR CORESB. Spectral Energy Distributions and Temperatures Detected at 90 & 200 μm (from ISO)
II. PRE-STELLAR CORESB. Spectral Energy Distributions and Temperatures Detected at 850 μm (from SCUBA) Detected at 1.3 mm (from IRAM)
II. PRE-STELLAR CORESB. Spectral Energy Distributions and Temperatures The spectral energy distribution of L1544 in the far-infrared and sub-millimeter wavelength
II. PRE-STELLAR CORES • A. Definition and Identification • B. Spectral Energy Distributions and Temperatures • C. Mass and Density Structure • D. Lifetimes
II. PRE-STELLAR CORESC. Mass and Density Structure For an isothermal dust source, total mass(gas+dust): is the average mass column density is sub-millimeter flux density is the dust opacity(1.3mm) 0.005 for pre-stellar cores of intermediate densities 0.01 for denser cloud cores and proto-stellar envelopes 0.02 for proto-planetary disks
II. PRE-STELLAR CORESC. Mass and Density Structure Upper: radial intensity profile of the pre-stellar core L1689B at 1.3 mm. Lower: the profile of a spherical isothermal core model with
II. PRE-STELLAR CORES • A. Definition and Identification • B. Spectral Energy Distributions and Temperatures • C. Mass and Density Structure • D. Lifetimes
II. PRE-STELLAR CORESD. Lifetimes Generally, we use the ratio of numbers of starless cores to numbers of cores with embedded IRAS sources to estimate their relative timescales. This figure shows the estimated lifetime of starless cores for each of six dark cloud.
II. PRE-STELLAR CORESD. Lifetimes This figure showsthe radial density profile predicted by an ambipolardiffusion model at different evolutionary stages (to ).
CONTENT • I. Introduction • II. Pre-Stellar Cores • III. The Youngest Proto-stars • IV. Summary
III. THE YOUNGEST PROTOSTARS • A. Class 0 Proto-stars and Other YSO Stages • B. Density Structure of the Proto-stellar Environment • C. Direct Evidence for Infall • D. Decline of Outflow and Inflow with Time
III. THE YOUNGEST PROTOSTARSA. Class 0 Proto-stars and Other YSO Stages • In the near-/mid-infrared, three broad classes of young stellar objects (YSOs) can be distinguished based on the slope of their SEDs. • Class 0 objects are defined by the following observational properties: (i) The detection of a compact centimeter radio continuum source, a collimated CO outflow, or an internal heating source.
III. THE YOUNGEST PROTOSTARSA. Class 0 Proto-stars and Other YSO Stages (ii) Centrally peaked but extended sub-millimeter continuum emission tracing the presence of a spheroidal circumstellar dust envelope. (iii) High ratio of sub-millimeter to bolometric luminosity suggesting the envelope mass exceeds the central stellar mass: Lsmm/Lbol >0.5%.
III. THE YOUNGEST PROTOSTARSA. Class 0 Proto-stars and Other YSO Stages • Combining infrared and submillimeter data, it is therefore to define a complete, empirical evolutionary sequence for low-mass YSOs: Class 0→Class I → Class II → Class III • This sequence can also be parameterized by the “bolometric temperature”, Tbol.
III. THE YOUNGEST PROTOSTARSA. Class 0 Proto-stars and Other YSO Stages
III. THE YOUNGEST PROTOSTARS • A. Class 0 Proto-stars and Other YSO Stages • B. Density Structure of the Proto-stellar Environment • C. Direct Evidence for Infall • D. Decline of Outflow and Inflow with Time
III. THE YOUNGEST PROTOSTARSB. Density Structure of the Proto-stellar Environment • In contrast to pre-stellarcores, Class 0 and Class I protostarsare always found to be strongly centrally-condensed and do notexhibit any inner flattening in their submillimetercontinuum radial intensity profiles. • Protostellar envelopes in regions of isolated star formation have radial density gradients generally consistent with .
III. THE YOUNGEST PROTOSTARSB. Density Structure of the Proto-stellar Environment • Many Class 0 protostars are in fact multiple systems, when viewed at sub-arcsecond resolution, sharing a common envelope and sometimes a circumbinarydisk. • These protobinaries are probably formed by dynamical fragmentation during the isothermal collapse phase.
III. THE YOUNGEST PROTOSTARS • A. Class 0 Proto-stars and Other YSO Stages • B. Density Structure of the Proto-stellar Environment • C. Direct Evidence for Infall • D. Decline of Outflow and Inflow with Time
III. THE YOUNGEST PROTOSTARSC. Direct Evidence for Infall • A comprehensive survey of a sample of 47 embedded YSOs in H2CO and CS suggests that infall is more prominent in Class 0 than in Class I sources. • In these transitions, infallasymmetries are detected toward 40–50 % of Class 0 objects but less than 10 % of Class I sources. This is consistent with a decline of rate with evolutionary stage.
III. THE YOUNGEST PROTOSTARS • A. Class 0 Proto-stars and Other YSO Stages • B. Density Structure of the Proto-stellar Environment • C. Direct Evidence for Infall • D. Decline of Outflow and Inflow with Time
III. THE YOUNGEST PROTOSTARSD. Decline of Outflow and Inflow with Time • Most Class 0 protostarsdrive powerful CO outflows, some outflow activity even exists throughout the accretion phase. • Luminosity of these outflows are often of the same order as the bolometric luminosity of the central sources. • For Class I objects, CO outflows are much less powerful and less collimated than Class 0 objects.
III. THE YOUNGEST PROTOSTARSD. Decline of Outflow and Inflow with Time • The decline of outflow power with evolutionary stage reflects a corresponding decrease in the mass-accretion/infall rate. • Decline of mass-accretionwith time does not imply a higher accretion luminosity for Class 0 compared to Class I because the central stellar mass is smaller at the Class 0 stage and the stellar radius is likely to be larger.
CONTENT • I. Introduction • II. Pre-Stellar Cores • III. The Youngest Proto-stars • IV. Summary