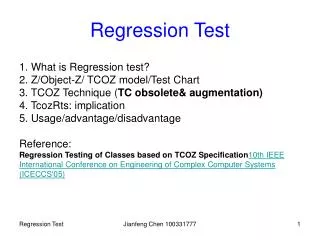
Prioritizing Test Cases for Regression Testing
Sebastian Elbaum University of Nebraska, Lincoln Alexey Malishevsky Oregon State University Gregg Rothermel Oregon State University. Prioritizing Test Cases for Regression Testing. ISSTA 2000. Defining Prioritization. Test scheduling During regression testing stage

Prioritizing Test Cases for Regression Testing
E N D
Presentation Transcript
Sebastian Elbaum University of Nebraska, Lincoln Alexey Malishevsky Oregon State University Gregg Rothermel Oregon State University Prioritizing Test Cases for Regression Testing ISSTA 2000
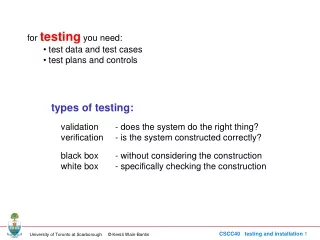
Defining Prioritization • Test scheduling • During regression testing stage • Goal: maximize a criterion/criteria • Increase rate of fault detection • Increase rate of coverage • Increase rate of fault likelihood exposure
Prioritization Requirements • Definition of goal • Increase rate of fault detection • Measurement criterion • % Of faults detected over life of test suite • Prioritization technique • Randomly • Total statements coverage • Probability of exposing faults
Previous Work • Goal • Increase rate of fault detection • Measurement • APFD: • weighted average of the • percentage of • faults detected over life of test suite • Scale: 0 - 100 (higher means faster detection)
TESTS Faults 1 2 3 4 5 6 7 8 9 10 A X X B X X X X C X X X X X X X D X E X X X Previous Work (2) Measuring Rate of Fault Detection A-B-C-D-E E-D-C-B-A C-E-B-A-D
Previous Work (3) Prioritization Techniques
Summary Previous Work • Performed empirical evaluation of general prioritization techniques • Even simple techniques generated gains • Used statement level techniques • Still room to improve
Research Questions • Can version specific TCP improve the rate of fault detection? • How does fine technique granularity compare with coarse level granularity? • Can the use of fault proneness improve the rate of fault detection?
Addressing RQ • New family of prioritization techniques • New series of experiments • Version specific prioritization • Statement • Function • Granularity • Contribution of fault proneness • Practical implications
Family of Experiments • 8 programs • 29 versions • 50 test suites per program • Branch coverage adequate • 14 techniques • 2 control “techniques” – optimal & random • 4 statement level • 8 function level
“Generic” Factorial Design Techniques Programs 29 Versions 50 Test Suites Independence of changes Independenceof suite composition Independence of code
Experiment 1a – Version Specific RQ1: Prioritization works on version specific at stat. level. • ANOVA: Different average APFD among stat. level techniques • Bonferroni: St-fep-addtl significantly better
Experiment 1b – Version Specific RQ1: Prioritization works on version specific at function level. • ANOVA: Different average APFD among function level techniques • Bonferroni: Fn-fep not significantly different than Fn-total
Experiment 2: Granularity • RQ2: Fine granularity has greater prioritization potential • Techniques at the stat. level are significantly better than functional level • However, “best” functional level are better than “worse” statement level
Experiment 3: Fault Proneness • RQ3: Incorporating fault likelihood did not significantly increased APFD. • ANOVA: Significant differences in average APFD values among all functional level techniques • Bonferroni: “Surprise”. Techniques using fault likelihood did not rank significantly better • Reasons: • For small changes fault likelihood does not seem to be worth it. • We believe it will be worthwhile for larger changes. Further exploration required.
Practical Implications APFD: Optimal = 99% Fn-fi-fep-addtl = 98% Fn-total = 93% Random = 84% Time: Optimal = 1.3 Fn-fi-fep-addtl = 2.0 (+.7) Fn-total = 11.9 (+10.6) Random = 16.5 (+15.2)
Conclusions • Version specific techniques can significantly improve rate of fault detection during regression testing • Technique granularity is noticeable • In general, statement level is more powerful but, • Advanced functional level techniques are better than simple statement level techniques • Fault likelihood may not be helpful
Working on … • Controlling the threats • More subjects • Extending model • Discovery of additional factors • Development of guidelines to choose “best” technique
Threats • Representativeness • Program • Changes • Tests and process • APFD as a test efficiency measure • Tools correctness
FEP Computation • Probability that a fault causes a failure • Works with mutation analysis • Insert mutants • Determine how many mutant are exposed by a test case FEP(t,s) = # of mutants of s exposed by t # of mutants of s
FI Computation • Fault likelihood • Associated with measurable software attributes • Complexity metrics • Size, Control Flow, and Coupling • Generated fault index • principal component analysis