Download
1 / 48
480 likes | 658 Vues
Estimating Gross Domestic Product, Informal Economy and Remittances of Mexico using Nighttime Satellite Imagery. Tilottama Ghosh Dr. Paul C. Sutton Dr. Christopher Elvidge. Radiance-calibrated Nighttime Image of the World, 2000-2001. Source: Earth Observation Group, NGDC, NOAA.

E N D
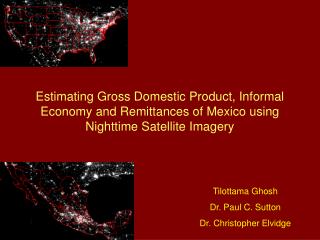
Estimating Gross Domestic Product, Informal Economy and Remittances of Mexico using Nighttime Satellite Imagery Tilottama Ghosh Dr. Paul C. Sutton Dr. Christopher Elvidge
Radiance-calibrated Nighttime Image of the World, 2000-2001 Source: Earth Observation Group, NGDC, NOAA
Images are derived from hundreds of orbits of the Defense Meteorological Satellite Program’s Operational Linescan System Screened for clouds, fires and other ephemeral light sources In the radiance calibrated nighttime images, the “brightness values” of the lights are converted from digital numbers to radiance values Radiance – calibrated nighttime Images of 1995-1996, 2000-2001, and 2005-2006 are available Helps to obtain brightness variations within urban centers Detection of diffused lighting in sparsely populated rural areas 30 arc-second grids (1 km2 at the equator), WGS 1984 coordinates Processed at NGDC, NOAA – Boulder, Colorado Nighttime Image of the World
Radiance-calibrated nighttime lights of the United States Source: Elvidge C. D., K. E. Baugh, J. B. Dietz, T. Bland, P. C. Sutton, and H. W. Kroehl. 1999a. Radiance calibration of DMSP-OLS low-light imaging data of human settlements. Remote Sensing of Environment 68: 77-88.
Objective of Study • Develop an alternative method to estimate the economic parameters of Gross Domestic Product (GDP), Informal economy and Remittances of an upper middle income country, Mexico based on – • Reliable estimates of sub-national GDP of a developed country, the United States, and • Based on the close relationship between lit urban areas, urban population and GDP, as derived from radiance calibrated nighttime satellite image
What caused the rise of informal economy in Mexico? • Neo-liberalism – Privatization, Deregulation and Trade Liberalization • Mexico – joining GATT in 1986, 1995 WTO substituted for GATT; signing NAFTA with the U.S. and Canada in 1994 • Consequences: • Downsizing the role of the state and employment in the traditional public sector • Creation of more temporary, low wage and unprotected employment • Outsourcing and subcontracting • Increased participation of women in the workforce
Informal Economy • Manifested in industrialized, transition and developing economies • Includes enterprises that are not legally regulated • Size of the unit is usually very small • Also includes employmentrelationships that are not legally regulated or protected • Includes informal employment both within and outsideagriculture • Includes self-employment in small unregistered enterprises and wage employment in unprotected jobs • No secure work, worker’s benefits or social protection
Remittances • Funds sent by international migrants to their countries of origin
Some other definitions • Gross Domestic Product (GDP): Total market value of all final goods and services produced within a given country or region in a given period of time (usually a calendar year) • Gross National Income (GNI): It is GDP plus net receipts of primary income (compensation of employees and property income from abroad) • GNI and GDP are usually expressed in PPP US dollars • This provides a better comparison of average income or consumption between economies
Where does informal economy and remittances fit in GDP and GNI? • Informal economy contributes to a large portion of the employment and the GDP of the nations, especially for the developing countries • By definition, remittances are included in the GNI of a country • GNI thus includes both informal economy and remittances
Importance of Study • Problems of estimating employment in the informal economy and its contribution towards GDP • Complexity of definition – Employment in informal enterprises and those employed informally (without any benefits and social protection) in formal enterprises • Data on informal sector employment has been collected in only five countries – Tunisia, South Africa, Kenya, Mexico and India • Indirect methods are still used to estimate informal employment outside informal enterprises and thus total informal employment
Problems associated with data on remittances • Formal remittances may go unrecorded, due to weaknesses in data collection – related to both definitions and coverage • Flows through informal channels – unregulated money transfers or friends and family who carry remittances • Remittances are misclassified as export revenue, tourism receipts, nonresident deposits, or even foreign direct investment
International comparability of data is difficult • In implementing the International Statistical definition of the informal sector, countries apply different criteria of non-registration, enterprise size • Some countries include informal employment in the agricultural sector and some countries do not • Data on the informal sector (excluding agriculture) are often compared to data on the total workforce (including agriculture) resulting in underestimation of the informal sector
Importance of Study The Economists’ blunder in overestimating the Chinese economy by 4 trillion dollars!!! (New York Times, December 9, 2007; Reported by Eduardo Porter)
So, why nighttime imagery again? • Nighttime imagery serves as a proxy measure of population and correlates of population such as economic activity and energy consumption • Proxies of socio-economic data has been generated at regional, national, sub-national, and other irregular spatial units • Available in time series, allows for change detection
The Land/Geographic Unit area grids (2000) obtained from Global Rural–Urban mapping project dataset produced by the Center for International Earth Science Information Network • Urban area extent grid expressed in square kms • Derived from NOAA’s stable city lights dataset • ESRI- Digital Chart of the World’s populated places • Tactical pilotage charts – Africa and Latin America • 30 arc-second grids • WGS 1984 coordinates
Landscan Population Database (2000) • Developed in the Oak Ridge National Laboratory (ORNL) • Estimating urban populations at risk • Apportioning census counts to each grid cell at sub-national levels on the basis of likelihood coefficients based on proximity to roads, slope, land cover, nighttime lights. • 30 arc-second grids and WGS 1984 coordinates
Other Data Sources • Informal economy data: • Mexico – INEGI - System of National Accounts, Accounts by Institutional Sectors, Satellite account of the informal sub-sector of homes, 1998-2003 • Contribution of informal economy towards GDP in Mexico was 12.3 percent in 2000 (INEGI) • Contribution of informal economy towards GDP in the U.S. is approximately 10 % (Mattera 1985; Investor’s Business daily 1998; Losby et al 2002; Mctague 2005) • Data on remittances from Bank of Mexico’s website • In 2000, remittance inflow into Mexico was 6.6 billion dollars
Analyses of Data • Google Earth for determining urban cluster threshold • ArcView GIS 9.3 for raster and vector analyses • JMP, Version 6 for statistical analyses
Selecting threshold for demarcating urban clusters Nighttime satellite image Threshold of 20*1.35*10-10 watts/cm2 /sr Google Earth
Why 20*1.35*10-10 as the threshold value? Kansas • The same threshold is used for delineating the urban areas of Mexico • A higher threshold would not capture the smaller urban areas of Mexico
Population and Area of the clusters are determined Demarcated clusters placed on the area grid Demarcated clusters placed on the population grid ‘Sum’ of the population of the clusters are obtained ‘Sum’ of the area of the clusters are obtained
Disaggregated (fine resolution) numbers for money are not available, so disaggregated population numbers serve as proximate measures of GDP Estimated urban population of the clusters is determined from the log-log relationship of the area and population of the urban clusters in the US Estimated urban population of the states of the US are determined Estimated urban population and official GDP figures of the US are used to estimate GDP of the states of the US All of US’s parameters are then used to estimate the urban population and GDP of the states of Mexico
Log – log Relationship between Population and Area of the Urban Clusters Equation weighed by population so that larger cities have a greater influence on the estimation of the regression parameters than the smaller cities Slope and intercept parameters are used to estimate the urban population of the states of Mexico Ln(Est Urb Pop) = 4.4234017 + 1.192936*Ln(Area) R2 = 0.96 Estimated urban population of the clusters : Estimated urban population = Exp (4.4234017 + 1.192936*Ln(Area)) Of the urban clusters of US
Population Density of the Clusters • Population density of the clusters are found out (Population/area) or population per km2 • Population of the states are determined using the Spatial Analyst tool in ArcGIS
Sum of Light of the States of US • Sum of lights of all the states of the US are determined using the Spatial Analyst tool in ArcGIS • Lights = money. Includes all those lights (that is, money) below the selected threshold level
Estimating GDP of the states of US • Estimated urban population of the states of the US, Sum of lights of the states of US and Published, official figures of the GDP of US are used to estimate the estimated GDP of the states of US • The published, official sub-national GDP values of the US are considered more reliable than that of any developing countries • 10 percent contribution of informal economy towards GDP is added to GDP Slope and intercept parameters are used to estimate the GDP of the states of Mexico Ln (Actual GDP) Ln(Est GDP) = (5.3297817 + 0.3941618 * Ln(Est Urb Pop) + 0.00000020098 * Sum of Lights) Est GDP = Exp (5.3297817 + 0.3941618 * Ln(Est Urb Pop) + Of the 0.00000020098 * Sum of Lights) states of US Ln (Est Urban Pop) Sum of lights Weighing by Actual GDP R2 = 0.84
Actual versus Estimated GDP of US P < .0001
Residual Map PercentageResidual = ((Actual GDP – Estimated GDP) /Actual GDP) * 100
Assumptions of this Analysis Patterns of Light are proxy measures of patterns of Money (e.g. GDP) Income distributions within a country are uniform (people in Texas have the same average incomes and income distributions as people in Nebraska, California, and Florida) We use disaggregate population information as a proxy measure of money because disaggregate GDP info not available
Demarcating lit areas of Mexico Nighttime satellite image Same threshold of 20*1.35*10-10 watts/cm2 /sr is used Google Earth
At this threshold level many of the smaller urban settlements are captured
Determining population and area of the clusters Estimated urban population of the clusters determined using US Parameters: Estimated urban population of the urban Clusters of Mexico = Exp (4.4234017 + 1.192936*Ln(Area)) Demarcated clusters placed on the area grid ‘Sum’ of the area of the clusters are obtained
Population Density of the Clusters • Population density of the clusters are found out (Population/area) or population per km2 • Population of the states are determined using the Spatial Analyst tool in ArcGIS
Sum of Light of the States of Mexico • Sum of lights of all the states of the Mexico are determined using the Spatial Analyst tool in ArcGIS • Lights = money. Includes all those lights (that is, money) below the selected threshold level
Estimating GDP of the states of Mexico The GDP of the states of Mexico are determined using US’s parameters Ln(Est GDP) = (5.3297817 + 0.3941618 * Ln (Est Urb Pop) + 0.00000020098 * Sum of Lights) Est GDP = Exp (5.3297817 + 0.3941618 * Ln (Est Urb Pop of Mexican states) + Of the 0.00000020098 * Sum of Lights of the Mexican states) states of Mexico
Actual vs Estimated GDP of Mexico Distrito Federal and Mexico state are outliers
Actual vs Estimated GDP of Mexico Mexico Excluding Distrito Federal improves the R2 and Significance level
Residual Map PercentageResidual = ((Actual GDP – Estimated GDP) /Actual GDP) * 100
Preliminary Results (Using US’s parameters to estimate urban population and also GDP)