Download
1 / 18
180 likes | 313 Vues
Contrasts in Development between and within a country. Case Study: Brazil. Learning outcomes. To study how wealth is not equally spread within countries Using Brazil as an example. Spatial aspects of Development.

E N D
Contrasts in Development between and within a country Case Study: Brazil
Learning outcomes • To study how wealth is not equally spread within countries • Using Brazil as an example
Spatial aspects of Development • Wealth is never spread evenly through a country, but tends to be concentrated in certain areas • These are known as the CORE and have a concentration of population, wealth and resources • The periphery consists of sparsely populated areas which are less developed than the core
Global Scale: North South Divide • On a world scale the developed countries constitute the global core, whereas the developing countries make up the periphery
The Gap between the North and South • The developing world has 75% of the world’s population • But… (world scale %) • 15% of energy consumption • 17% GNP • 30% food grains • 18% exports • 11% education spending • 6% health expenditure
Regional Scale Divide: Brazil • Brazil is 8,512,000 Km2 • Covers 1/3 of South America • Population approx 150 million- x3 that of the UK • There is a core part of the country: SE • There is a periphery part of the country: NE
Historical Background • People have settled in the country from : Britain, Portugal, Italy, Japan and Africa • First claimed in 1500 by Portugal • Trade developed in the NE and during the 1690s agricultural products/ minerals were taken back to Portugal from Brazil • Salvador in the NE was the old capital
Historical background cont. • Coffee was grown in the SE where the was a less extreme climate • Slaves were brought in from Africa to work • 1763 Rio became the capital reflecting a decline from the NE • Independence from Portugal in 1822 • Early 20th century SE became the economic core region producing iron, steel, food products and engineering work • 1970/80s car industry • 1960s government planned a new capital: Brasilia
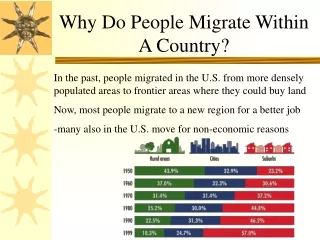
Growth of cities • ¾ of all Brazilians live in urban areas • Rural to urban migration particularly from NE regions • Main destinations for the migrants where cities: Rio Sao Paulo, Belo Horizonte in the SE
The South East vs North East • SE: Core region Population density 63 per km2 NE: Periphery Population density 25 per km 2 Differences between the two are a result of: Historical Physical Economic Social factors
Historical Factors • As mentioned before • NE first core area based on Portuguese colony , Salvador the old capital • Coffee growing started in SE, better climate • Rio became the capital • Other industries started to develop in the area, new capital city developed
Physical • SE has a more desirable climate • NE very arid • SE has all year round growing season due to reliable rainfall 2000mm per year of rain • Amazon rainforest has stopped development in North of Brazil • NE has unreliable rainfall <500mm of rain making it prone to drought • SE has terra rossa soils- good soils, better than NE
Economic • Better job opportunities in the SE • 70% employed in industry in SE • 10% in NE • Car manufacturing in SE (VW) • 54% of population live in SE and it has 64% of the wealth
Social • Services have centralised in the SE • 550% growth in the last 45 years in the number of city dwellers • Better education than the NE • Infant mortality and life expectancy much better in SE
Recap • Global disparities in wealth e.g. North- South Divide • Regional: Brazil • Due to historical, economic, physical and social factors • Core region SE compared to periphery: NE