Download
1 / 3
30 likes | 165 Vues
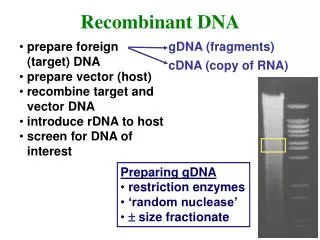
This document presents an analysis of figures from Takeda et al., focusing on Supplemental Figures 1, 2, and 3. Figure 1 explores sequence height variations and the comparison of gDNA mixes using different experimental setups. Figure 2 examines the effects of fixation and sonication on miRNA interactions with hAGOs. Lastly, Figure 3 displays quantitative log2 transformations of input versus immunoprecipitation (IP) results, providing insights into the miRNA and gDNA dynamics. The findings contribute to understanding regulatory mechanisms at the molecular level.

E N D
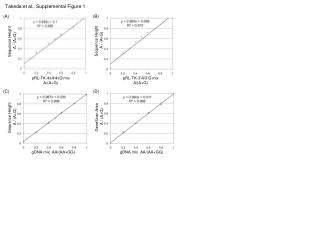
Takeda et al., Supplemental Figure 1 (A) (B) A / (A+G) Sequence Height Sequence Height A / (A+G) pRL-TK-4xA/4xG mix A/(A+G) pRL-TK-3’A/3’G mix A/(A+G) (C) (D) GeneScan Area A / (A+G) Sequence Height A / (A+G) gDNA mix AA/(AA+GG) gDNA mix AA/(AA+GG)
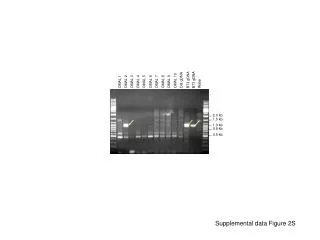
Takeda et al., Supplemental Figure 2 (A) No Fixation With Fixation Input Sup IP Input Sup IP Sonication L L H H L L H H L L H H L L H H L H H L L H H miRNA 1 1M 1 1M 1 1M 1 1M 1 1M 1 1M 1 1M 1 1M 1M 1 1M 1 1M 1 1M hAGOs * h l (B) No Fixation With Fixation Sonication L L H H L L H H miRNA 1 1M 1 1M 1 1M 1 1M + - + - + - + - + - + - + - + - RT Input IP Log2 [ (A/GIP) / (A/Ginp) ]
Takeda et al., Supplemental Figure 3 Input IP Log2 [ (A/G) / (A/G gDNA) ]