Download

1 / 55
550 likes | 675 Vues
Six Sources of Bias or error – six simple things that can badly skew your results. PROFESSIONAL DEVELOPMENT SERIES - 2011. Six Sources of Bias and error – six simple things that can badly skew your results.

E N D
Six Sources of Bias or error – six simple things that can badly skew your results. PROFESSIONAL DEVELOPMENT SERIES - 2011
Six Sources of Bias and error – six simple things that can badly skew your results. • The focus of this workshop is on the serious side effects stemming from simple aspects of questionnaire and analytical design. • For example the common practice of presenting respondents with big batteries of questions can lead not only to boredom and indifference, but also to serious skews. • And our analytical approach may also exaggerate our results as well. This workshop is a two-hour refresher course to help researchers stay on top of the game. It includes: • Whose universe is it anyway? The effects of simple ‘screener’ questions. • Question sequencing – how question order can markedly change results. • The peril of big batteries. • Framing effects. The effect of prompts and tone on the way people answer questions. • You get what you test: the effects of assumptions and hypotheses on the data you get back. • Analytical effects – how your choice of analysis may exaggerate your results. • Armed with this workshop, the professional researcher, and client, will be better aware of the common pitfalls that can secretly devalue your research.
Sampling and design issues DISCUSSION ONE
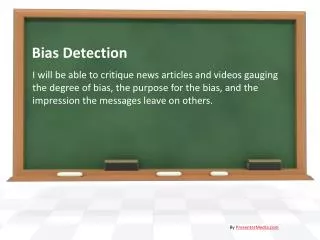
Hone questions Maori Party’s cosy relationship with National....
NZ Herald - Hone Harawira survey • Those who say the alliance with National has been bad for Maori people (37%) outnumber those who think it has been good for Maori (23%). The other 24% see some good and some bad in the coalition, and 16% are unsure or won't say.
NZ Herald - Hone Harawira survey • Those who say the alliance with National has been bad for Maori people (37%) outnumber those who think it has been good for Maori (23%). The other 24% see some good and some bad in the coalition, and 16% are unsure or won't say. • “The Weekend Herald went looking for voters on the Maori roll up and down the Te Tai Tokerau electorate, which extends from Cape Reinga down to the Auckland Harbour Bridge and into West Auckland to the eastern edge of the Waikumete Cemetery.” N=70 • The question is – in other electorates does the percentage who see the Maori Party/National party alliance as “bad” differ from the figure here in Hone’s electorate. Has Hone stirred up any particular feeling in his electorate??
Whose universe is it anyway? The effects of sampling and simple ‘screener’ questions. • When we conduct a survey we make some huge decisions to begin with: • Sample size. How many people will we listen to? • Who is our sample universe? • Very often we are required to zoom-in on a sample universe that is quite tight, and, scientifically, we lose something along the way.
Whose universe is it anyway? US Political Polling As we drill down, our sampling becomes more problematic and our assumptions start becoming more risky. How do we know what the likelihood of voting will be?
Getting the sampling right. • Get a sample that’s big enough to work with. • Not just overall sample size • But size of sub-sample. • Set quotas that reflect the sample universe. • Specify number of call-backs in order to reach a fair sample of hard to reach people. • Don’t over-rely on assumptions. • Don’t drill down too tight. Seek an element of comparability.
Checklist for professionals CHECKLIST • Spend extra time getting your sampling sorted out. • Sample size (main sample and sub-groups) • Quotas to reflect the ‘universe’ • Efficiency is good (do you really wish to listen to people who don’t receive the product or service being tested?) but don’t lose your reference point. Good science always has a ‘control.’ • Are we hearing all stakeholders?
Question sequencing and context DISCUSSION TWO
Directional context effects. An experiment in 1950 and 1983.The communist and reporter questions. Should a communist country like Russia let American newspaper reporters in and send back news as they see it? • Should the United States let Communist newspaper reporters come in here and send back to their countries news as they see it?
Directional context effects. An experiment in 1950 and 1983. Thecommunist and reporter questions. 1950 1950 Should a communist country like Russia let American newspaper reporters in and send back news as they see it? • Should the United States let Communist newspaper reporters come in here and send back to their countries news as they see it? 36% When asked first 73% When asked second
Directional context effects. An experiment in 1950 and 1983. The communist and reporter questions. 1983 1983 Should a communist country like Russia let American newspaper reporters in and send back news as they see it? • Should the United States let Communist newspaper reporters come in here and send back to their countries news as they see it? 55% When asked first 75% When asked second
Types of contextual effect • Retrieval effects. (Different answers if you come in cold versus easing your way into the subject.) • Correlation context effects on judgement • Assimilation effects – context drives up support for a position. (Such as the communist reporter questions. ) • Contrast effects – when general questions follow specific questions. (How happy is your marriage? How happy are you in life generally?)
Do you favour or oppose the passage of the Monetary Control Bill? Preceding block of questions Do you favour or oppose the passage of the Monetary Control Bill? OPPOSE FAVOUR DON’T KNOW NEUTRAL QUESTIONS FIRST 25% 13% 63% SCATTERED INFLATION QUESTIONS FIRST 20% 9% 71% BLOCK OF INFLATION QUESTION FIRST 18% 28% 55%
Checklist for professionals CHECKLIST • Just generally, try an ease respondents into a topic – give them a moment to get into survey mode, and to retrieve the subject matter cognitively. A good role for the intro-text. • Try to design questionnaires that go from general to specific – from macro to micro. • Test or allow for order effects. • Sometimes there’s no way around it – you end up with a reporter/communist moment and neither question “belongs” in front. Then one solution is to reword both questions – “some people say this, others say that...what do you feel about letting reporters in?”
Framing effects – at a more micro level within the question. DISCUSSION THREE
Framing effects. The effect of prompts and tone on the way people answer questions. • Framing is dictated by choices. • Here’s an example from Don Ariely.
Which one would you pick? 16% 0% 84%
Which one would you pick? TWO CHOICES – THE DECOY IS REMOVED 16% 68% 84% 32%
What just happened? • The three choices were about two things. • Delivery medium (web versus hard copy.) • The price $59 versus $125.) • The unintentional (or very intentional) effect of having the unpopular middle choice was to frame the options mostly in terms of delivery media. Hey – two media for the price of one! • The simpler choice framed it in terms of cost. Why pay more than $59? • The issue is one of framing.
Response order effects • Primacy and recency – can effect the way we deal with and retrieve our thoughts. • Primacy effects occur more in written surveys. First mentioned gets more votes. • Recency effects occur more often in phone surveys. Last mentioned gets more votes.
Acquiescence Bias • A tendency to agree with unbalanced statements. • The satisficing theory suggests that respondents tend to assume that the main option on offer is probably the “correct” option. The easiest response is simply to “agree.”
The presence of a “No Opinion” filter. • Traditionally we’re trained to include “No Opinion” as an option. • Findings suggest that most people who offer “no opinion” do have an opinion. By removing the option you encourage a more thoughtful answer. • A matter of judgement.
"Which parent should have custody of the child?" Parent B has a close relationship with the child but a job that would take him or her away for long periods. Parent A is moderately suitable to be the guardian in multiple ways.
"Which parent should be denied custody of the child?" Parent B has a close relationship with the child but a job that would take him or her away for long periods. Parent A is moderately suitable to be the guardian in multiple ways.
Checklist for professionals CHECKLIST • Think “Economist Example” where framing shifted respondents from one dimension (delivery medium) to another (price) simply through the answer options. • Think carefully about “no opinion” – if possible, work the respondent a little harder to deliver an opinion. Don’t let it become the lazy or satisficing option. • Ensure questions are neutrally worded – and that answer options are consistently framed.
Big batteries DISCUSSION FOUR
Avoid huge batteries. • Tiresome to fill in. • They drive respondents to use a satisficing heuristic which goes like this: • Read the top question. Answer it as well as you can. • Do the same for the second question. Get the gist? • Then skim the other questions and anchor your answer around about the same result as your top two. • Anchoring effect: your answer for the first question influences your answers for the rest of the battery.
THIS DRAG AND DROP EXERCISE IS MORE INTUITIVE – AND ACTUALLY HANDLES MORE DATA THAN THE PREVIOUS PAGE. Here’s a sorting exercise: which words go with which brand? Simply drag the words into the appropriate bucket below. NONE OF THESE BRANDS
Checklist for professionals CHECKLIST • Avoid big batteries. The are cognitively tedious, lead to “lazy answering.” • Less questions perhaps? Perhaps you need to run some qualitative research first to refine your search. • Break batteries up – try for a maximum of 8 rows or less. • Try alternatives that are more engaging.
You get what you test: the effects of assumptions and hypotheses on the data you get back. DISCUSSION FIVE
You get what you test: the effects of assumptions and hypotheses on the data you get back. • We need to be very careful about the assumptions we make, and the conclusions we reach. • To illustrate – let’s look briefly at two case studies. • Aluminium. • Breakfast.
Evidence linking aluminium and Alzheimer's disease? • The hypothesis that there is a link between aluminium and Alzheimer's disease was first put forward in the 1960s (Terry and Pena 1965, Klatzo et al 1965). Since then, researchers have claimed a number of other circumstantial links between aluminium and Alzheimer's disease. • Aluminium has been shown to be associated both with plaques and with tangles in the brains of people with Alzheimer's disease (Crapper et al 1976). • However, the presence of aluminium does not mean that the aluminium was the causal factor − it is more likely to be a harmless secondary association. • Some have claimed that people with Alzheimer's disease have a higher than average level of aluminium in their brains. However, other studies find no difference between the overall amount of aluminium in the brains of people with Alzheimer's and the amount in normal brains (Trapp et al 1978).
One example of research that proved the link. • Guam Island • Positive testing for aluminium Chamorro People Cycad Plant
Kellogg survey in Australia, 2008 • Teachers Rate Breakfast Cereal Top of the Class Australian parents urged to serve healthy fibre this termAttentiveness in the classroom can be a key indicator that a child has had breakfast, according to the results of a recent survey of 1,000 Australian primary and secondary school teachers. In contrast, tiredness and lack of concentration are tell-tale signs that a child has skipped breakfast. • The nationwide survey was commissioned by Kellogg Australia to determine whether teachers’ experience in the classroom is consistent with the current research linking breakfast eaters with better concentration at school. • If the experience of Australian teachers is anything to go by, the research is right on the mark. • The findings revealed: • 96% of teachers say students who eat breakfast pay more attention; • 88% of teachers say that students who eat breakfast perform better at school; • 79% of teachers say that students who eat breakfast are more interested in learning than those who don’t. • When asked to nominate their choice of the best breakfast options for students, teachers nominated breakfast cereals as the most popular option. • Release Date : 09-09-2008Teachers Rate Breakfast Cereal Top of the Class
Anyone have a problem with this? • Kids who have breakfast perform better at school • Kids who eat breakfast are more interested in learning. • Cereal is the most popular form of breakfast. • Hence – kids who eat Kellogg’s do better at school.
So two common problems. Reinforcing common beliefs Clients seek to ‘prove a point.’ Being commissioned by FMCG to help a marketing message. Being commissioned by a lobby group to test opinions. Being commissioned by a Government Department that wants to listen – but does not want to be criticised. • Examples include much discussion about so-called generations x and y. • Or assumptions about “left and right” in political surveys. (Apparently still the prevailing paradigm?)
Checklist for professionals CHECKLIST • Be careful of conventional wisdom. It just may be wrong. • Be careful of clients who want to “prove a point” – be extra rigorous because it’s your research that will get questioned. • Don’t just prove something is true –test whether the opposite is false as well.
We’re here to make up the numbers. Analytical effects. DISCUSSION SIX
Analytical effects – how your choice of analysis may exaggerate your results. • Logical errors. Often to do with causality. • TV One viewers are older – therefore, TV One makes people age rapidly. (Actually, I think it does.)
Analytical effects – how your choice of analysis may exaggerate your results. • Mean scores without statistical testing. • We run the risk of inferring differences when these nuances are not significant. The grey square optical illusion.
Analytical effects – how your choice of analysis may exaggerate your results. • Segmentation techniques have the effect of categorising what often begins as mushy data. • We’re forcing shades of grey to masquerade as black and white. • We then exaggerate this effect by applying pithy labels that further over-simplify the differences. One can segment the contents of this glass into three distinct categories!
273 PEOPLE ANSWERED FOUR QUESTIONS WE USED FOR A SEGMENTATION/CLUSTER ANALYSIS. Which solution is best? K-means cluster for 3, 4, 5 or 7? 2 step cluster?
Analytical effects – how your choice of analysis may exaggerate your results. • Often we have a drive to “find something” when there may be very little going on in the data (either because the questions were not discriminating, or the subject just isn’t passionate.) • Perhaps the answer is – there IS no answer. • Then we run the risk of Confirmation bias. Do we see what we choose to see?
We may be biased without realising it! Here are six reasons for bias. • Biased search for information • Preference for early information • Persistence of discredited beliefs • Biased memory – or recency effects • Biased analytical style – for example testing for positive relationships, but not testing for negative relationships. • Biased interpretation – including illusions