Download
1 / 30
300 likes | 503 Vues
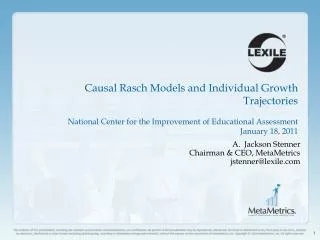
Causal Rasch Models and Individual Growth Trajectories National Center for the Improvement of Educational Assessment January 18, 2011. Jackson Stenner Chairman & CEO, MetaMetrics jstenner@lexile.com.

E N D
Causal Rasch Models and Individual Growth TrajectoriesNational Center for the Improvement of Educational AssessmentJanuary 18, 2011 • Jackson Stenner • Chairman & CEO, MetaMetrics • jstenner@lexile.com
“Although adopting a probabilistic model for describing responses to an intelligence test, we have taken no sides in a possible argument about responses being ultimately explainable in causal terms.” (Rasch, 1960, p.90)
Three well researched constructs • Reader ability • Text Complexity • Comprehension
Reader Ability Temperature
Reading is a process in which information from the text and the knowledge possessed by the reader act together to produce meaning. Anderson, R.C., Hiebert, E.H., Scott, J.A., & Wilkinson, I.A.G. (1985) Becoming a nation ofreaders: The report of the Commission on Reading Urbana, IL: University of Illinois
An Equation Conceptual Text Complexity Reader Ability - = Comprehension Statistical e (RA – TC ) i Raw Score = 1 + e (RA – TCi) i RA = Reading Ability TC = Text Calibrations
Each of these thermometers is engineered to use the same correspondence table Each of these reading tests is engineered to use the same correspondence table
Ten Features of Causal Response Models – whether Guttman or Rasch • Both measurement procedures depend on within-person causal interpretations of how these two instruments work. NexTemp uses a causal Guttman Model, The Lexile Framework for Reading uses a causal Rasch Model. • In both cases the measurement mechanism is well specified and can be manipulated to produce predictable changes in measurement outcomes (e.g. percent correct or percent of cavities turning black). • Item parameters are supplied by substantive theory and, thus, person parameter estimates are generated without reference to or use of any data on other persons or populations. Therefore, effects of the examinee population have been completely eliminated from consideration in the estimation of person parameters for reader ability and temperature.
Ten Features of Causal Response Models – whether Guttman or Rasch cont’d. • In both cases the quantitivity hypothesis can be experimentally tested by evaluating the trade-off property. A change in the person parameter can be off-set or traded-off for a compensating change in the measurement mechanism to hold constant the measurement outcome. • When uncertainty in item difficulties is too large to ignore, individual item difficulties may be a poor choice to use as calibration parameters in causal models. As an alternative we recommend, when feasible, averaging over individual item difficulties to produce “ensemble” means. These means can be excellent dependent variables for testing causal theories. • Index models are not causal because manipulation of neither the indicators nor the person parameter produces a predictable change in the measurement outcome.
Ten Features of Causal Response Models – whether Guttman or Rasch, cont’d. • Causal Rasch models are individual centered and are explanatory at both within-subject and between-subject levels. The attribute on which I differ from myself a decade ago is the same attribute on which I differ from my brother today. • When data fit a Rasch model differences between person measures are objective. When data fit a causal Rasch model absolute person measures are objective (i.e. independent of instrument). • The case against an individual causal account, although popular, has been poorly made. Investigators need only experiment to isolate the causal mechanism in their instruments, test for the trade-off property and confirm invariance over individuals. This has been accomplished for a construct, reader ability, that has been described by scholars as the most complex cognitive activity that humans regularly engage in. Given the success with reading, we think it likely that other behavioral constructs can be similarly measured. • Causal Rasch models make possible the construction of generally objective growth trajectories. Each trajectory can be completely separated from the instruments used in its construction and from the performance of any other persons whatsoever.
To causally explain a phenomenon [a measurement outcome] is to provide information about the factors [person processes and instrument mechanisms] on which it depends and to exhibit how it depends on those factors. This is exactly what the provision of counterfactual information…accomplishes: we see what factors some explanandum M [measurement outcome, raw score] depends on (and how it depends on those factors) when we have identified one or more variables such that changes in these (when produced by interventions) are associated with changes in M (Woodward, 2003, p.204).
Figure 1: Plot of Theoretical Text Complexity versus Empirical Text Complexity for 475 articles “Pizza Problems” r = 0.952 r” = 0.960 R2” = 0.921 RMSE” = 99.8L
What could account for the 8% unexplained variance? • Missing Variables • Improved Proxies/Operationalizations • Expanded Error Model • Rounding Error • Interaction between Individual and Text • Psychometric Uncertainty Principle
Student 1528 6th GradeMaleHispanicPaid Lunch May 2007 – Dec. 2009 284 Encounters117,484 Words2,894 Items848 Minutes Text Demands forCollege and Career 1600 1400 1200 1000 May 2016(12th Grade) 21
Reading Task-Complexity Plane for Dichotomous Items Unit Size Adjustment Applied to Logits 1.3 1.2 1.1 1.0 0.9 0.8 0.7 Added Easiness Added Hardness Auto-Generated Cloze Production Cloze Native Lexile
Comparing Item-Based vs. Ensemble-Based Psychometrics • Item-Based • Item statistics • Item characteristic curves • DIF for items • Ensemble-Based • Ensemble statistics • Ensemble characteristic curves • DIF for ensembles
1300L(132L) The Ensemble • Objective: Correspondence Table • Raw score to Lexile measure • What we think we know • Mean and spread of item distributions for a passage • What is assumed to be unknown • Individual item difficulties
The Process – Iteration 1 STEP 1 Sample 45 Item Difficulties from Ensemble STEP 2 Compute Lexile Measures for Each Raw Score (1 to 44) STEP 3 Table Results Sample 1 Raw Score 123...44 Lexile Measure 362L514L584L...1811L
The Process – Iteration 2 STEP 1 Sample 45 Item Difficulties from Ensemble STEP 2 Compute Lexile Measures for Each Raw Score (1 to 44) STEP 3 Table Results Sample 1 Sample 2 Raw Score 123...44 Lexile Measure 362L514L584L...1811L Lexile Measure 354L506L575L...1797L
The Process – Iteration 1,000 STEP 1 Sample 45 Item Difficulties from Ensemble STEP 2 Compute Lexile Measures for Each Raw Score (1 to 44) STEP 3 Table Results Sample 1 … Sample 1,000 Mean of 1,000 Mean Lexile Measure 378L509L589L...1829L Raw Score 123...44 Lexile Measure 362L514L584L...1811L Lexile Measure 354L506L575L...1797L
Closing No matter how it is sliced and diced, analyses of joint and conditional probability distributions yield no more than patterns of association. Nothing in the response data nor Rasch analyses of these data exposes the processes (features of the object of measurement) or mechanisms (features of the instrument) that are hypothesized to be conjointly causal on the measurement outcomes.
Contact Info: A. Jackson Stenner CEO, MetaMetrics jstenner@Lexile.com