Download
1 / 21
320 likes | 723 Vues
Learn about spectroscopy techniques, including absorption, photoluminescence, Raman spectroscopy, and more. Explore the equipment, optics, and experimental methods used in this field to study electromagnetic radiation interactions with matter.

E N D
Introduction to laser spectroscopy techniques 黃建智 Department of Physics Nation Taiwan University P/NSTL@NTU
Outline What is spectroscopy ? Absorption Photoluminescense Raman spectroscopy Summary Reference P/NSTL@NTU
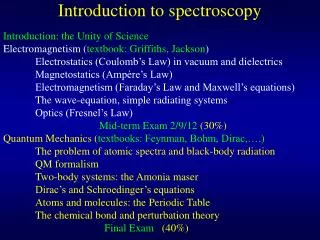
Spectroscopy? Wavelength 1nm 100cm 100m 1m 100nm 10nm 10m 10-6eV 10-4eV 10-2eV 1eV 10eV 100eV 1keV 10keV Photonenergy VUV Soft X-rays (SXR) RADIO IR Hard X-rays UV Extreme Ultraviolet (EUV) MICROWAVE Molecul-ar Vibrations Finestructure Outer Electron Trans • deals with the interactions of electromagnetic radiation with matter as related to the transitions between specific energy states of chemical species • The data that is obtained from spectroscopy is called a spectrum • energy-level structure of physical system • The choice of spectroscopic method is primarily determined by the energy range of the phenomenon to be studied 0.1nm P/NSTL@NTU
WhatInstrumentsAreNeeded? Radiation source : Analyzer Detector P/NSTL@NTU
Radiation Source and Detector • Infrared Nernst filament (black body irradiation) • Visible Tungsten-halogen lamp (350 – 5000 nm) • UV Deuterium discharge lamp (190 – 350 nm) • Xenon discharge lamp (< 190 nm) • Lasers UV-Vis-NIR • Infrared :Semiconductors (HgCdTe, InSb, PbS, InGaAs) • Visible & UV : Photomultiplier: PMT Photodiode: Si Diode array detector Charge coupled device CCD P/NSTL@NTU
Optics of Spectrometer • Resolution depends on : 1.grooves/mm in relation to λ • 2. Length of monochromator • 3. Slit width • Constructive interference: • n = 1, 2, … is the diffraction order • d is distance between the grooves P/NSTL@NTU
Po P d rayleigh Types of Interaction Reflection\ Scattering Luminescence Absorption P/NSTL@NTU
1 0.8 when E = hv 0.6 * hv Absorban e (AU) E 0.4 0.2 0 GroundState ExcitedState 300 350 400 450 500 550 Wavelength (nm) Absorption transfer of energy from photon to atom or molecule which produces a transition from a lower energy to a higher energy level Recording the resultant change in light intensity as a function of wavelength (i.e. energy) is what allows us to characterize the structure of the absorbing molecule. P/NSTL@NTU
Experimental Techniques M1 Reference Beams from Monochrometer And Chopper sample Photomultiplier Absorpotion spectrometer detector Beam combiner sample source reference Source-dispersing element-detector P/NSTL@NTU
Foundamental absorption in semiconductor for for Eg for for • Direct transitions: • Indirect transitions: • Absorption tail : No absorption is to be expected below Eg . However many timesα decreases much more slowly below the fundamental edge than suggested by theory . Urbach repoted that the tail obeys a relationship Pankove found in GaAs that the slop of the absorption tail varies with impurity concentration P/NSTL@NTU
Photoluminescence Ec Ev Photoluminescence (PL) is the optical radiation emitted by a physical system from excitation to a non-equilibrium distribution of electronic state by irradiation with light. • Three distinct processes are involved: • Creation of electron-hole (e-h) pairs by absorption of the excited light. • Radiative recombination of the e-h pairs. • Escape of the recombination radiation from the solid being studied P/NSTL@NTU
Several Electronic Transitions in A Semiconductor e e e e Ec B-B D-V D-A C-A Ev h h h h (d) (c) (a) (b) • Conduction band to acceptor level • Donor level to valence band • Donor level to acceptor level • Conduction band to valence band • Excitonic recombinations Exciton energy band P/NSTL@NTU
Basic Experimental Setup Laser Lock-in Amp. Chopper Detector Monochromater Cryostat P/NSTL@NTU
Why Photoluminescence ? • Easy data collection. • No sample preparation required. • Contact-less\ non-destructive technique. Simplicity of experimental apparatus PL Can Efficiently Measure the Following in Semiconductors • Band: • Gap • Band offset • Lattice: • Alloy composition • Crystallinity • Stress • Impurity and defect: • Presence and type • Concentration • Microstructure: • Surface behavior • Interface behavior Direct relation between PL and radiative devices: LED, CRT’s, solid state lasers… P/NSTL@NTU
Thermalization effects P/NSTL@NTU
Raman spectroscopy • Raman spectroscopy is based on the scattering of light (or photons) by molecules • Rayleigh scattering is the result of elastic collisions between the photon and the molecule - energy of the photon is unchanged during the collision • Raman scattering is the result of inelastic collisions between the particles - energy of the photon and its direction, are changed during collision with the molecule Sir C. V. Raman discovered that the spectrum of scattered lines not only consisted of the Rayleigh lines but a pattern of lines of shifted frequency – the Raman spectrum P/NSTL@NTU
Stokes V.S. Anti-Stokes Lines Raman bands at frequency less than the incident frequency, (ni-nvib) are referred to as Stokes bands Those at frequency higher than the incident frequency, (ni+nvib) are referred to as anti-Stokes bands Raman band is not only characterized by its absolute wavenumber but by the magnitude of its wavenumber shift |Dn| from the incident wavenumber In general the population of a higher state is less than that of a lower state. Therefore more transitions from a lower state to a higher state are expected, thereby causing greater intensities in Stokes lines Rayleigh Stokes anti-Stokes hν P/NSTL@NTU
Theory • Since light possesses an electric field and molecules are made up of positive and negative charges, we can expect the molecule to become polarized in the light – an induced dipole moment. • The degree to which a dipole,P, is induced by the electric field, E, is described by the molecular polarizability, P= E • is related to how readily the electrons will move under the influence of an electric field with respect to the nuclei of the molecule. • If the molecule undergoes some internal motion, by rotating or vibrating, the polarizability will change as well, either in direction or magnitude, resulting in a change in the induced electric dipole. • The rate at which the polarizability changes is a direct measure of the motion in the molecule. • This allows us to use Raman spectroscopy to study rotations and vibrations in moleculesthat have induced electric dipoles, not permanent ones. P/NSTL@NTU
Experimental A monochromatic light source (i.e. laser) is shined on a sample and the scattered light is detected. Most of the scattered light will be a result of Rayleigh scattering, but a small amount will be a result of Raman scattering Using Different Excitation Wavelength to Eliminate Fluorescence Interference P/NSTL@NTU
Summary Spectroscopic methods are widely used for the determination of molecular structure, the characterization of unknown compounds….. It is powerful, easy, and fast 針對樣品特性選擇適當的光譜技術是必須的 光譜技術已是很成熟的技術,並且廣為應用,同時具有發展空間 P/NSTL@NTU
Reference V. Swaminathan and A. T. Macrander in ”Materials Aspects of GaAs and InP Based Structures” p.264~340 Sideney Perkowitz in “Optical Characterization of Semiconductors: Infrared’ Raman’ and Photoluminescence Spectroscopy” P/NSTL@NTU