Download
1 / 2
20 likes | 99 Vues
Anomalous Harmonics in the Spectra of GPS Position Estimates.

E N D
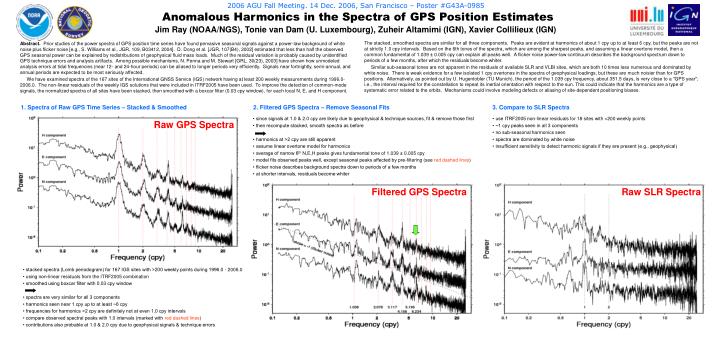
Anomalous Harmonics in the Spectra of GPS Position Estimates The stacked, smoothed spectra are similar for all three components. Peaks are evident at harmonics of about 1 cpy up to at least 6 cpy, but the peaks are not at strictly 1.0 cpy intervals. Based on the 6th tones of the spectra, which are among the sharpest peaks, and assuming a linear overtone model, then a common fundamental of 1.039 ± 0.005 cpy can explain all peaks well. A flicker noise power-law continuum describes the background spectrum down to periods of a few months, after which the residuals become whiter. Similar sub-seasonal tones are not apparent in the residuals of available SLR and VLBI sites, which are both 10 times less numerous and dominated by white noise. There is weak evidence for a few isolated 1 cpy overtones in the spectra of geophysical loadings, but these are much noisier than for GPS positions. Alternatively, as pointed out by U. Hugentobler (TU Munich), the period of the 1.039 cpy frequency, about 351.5 days, is very close to a "GPS year"; i.e., the interval required for the constellation to repeat its inertial orientation with respect to the sun. This could indicate that the harmonics are a type of systematic error related to the orbits. Mechanisms could involve modeling defects or aliasing of site-dependent positioning biases. Abstract. Prior studies of the power spectra of GPS position time series have found pervasive seasonal signals against a power-law background of white noise plus flicker noise [e.g., S. Williams et al., JGR, 109, B03412, 2004]. D. Dong et al. [JGR, 107(B4), 2002] estimated that less than half the observed GPS seasonal power can be explained by redistributions of geophysical fluid mass loads. Much of the residual variation is probably caused by unidentified GPS technique errors and analysis artifacts. Among possible mechanisms, N. Penna and M. Stewart [GRL, 30(23), 2003] have shown how unmodeled analysis errors at tidal frequencies (near 12- and 24-hour periods) can be aliased to longer periods very efficiently. Signals near fortnightly, semi-annual, and annual periods are expected to be most seriously affected. We have examined spectra of the 167 sites of the International GNSS Service (IGS) network having at least 200 weekly measurements during 1996.0-2006.0. The non-linear residuals of the weekly IGS solutions that were included in ITRF2005 have been used. To improve the detection of common-mode signals, the normalized spectra of all sites have been stacked, then smoothed with a boxcar filter (0.03 cpy window), for each local N, E, and H component. 2006 AGU Fall Meeting. 14 Dec. 2006, San Francisco – Poster #G43A-0985 1. Spectra of Raw GPS Time Series – Stacked & Smoothed 2. Filtered GPS Spectra – Remove Seasonal Fits 3. Compare to SLR Spectra Raw GPS Spectra • since signals at 1.0 & 2.0 cpy are likely due to geophysical & technique sources, fit & remove those first • then recompute stacked, smooth spectra as before • harmonics at >2 cpy are still apparent • assume linear overtone model for harmonics • average of narrow 6th N,E,H peaks gives fundamental tone of 1.039 ± 0.005 cpy • model fits observed peaks well, except seasonal peaks affected by pre-filtering (see red dashed lines) • flicker noise describes background spectra down to periods of a few months • at shorter intervals, residuals become whiter • use ITRF2005 non-linear residuals for 18 sites with >200 weekly points • ~1 cpy peaks seen in all 3 components • no sub-seasonal harmonics seen • spectra are dominated by white noise • insufficient sensitivity to detect harmonic signals if they are present (e.g., geophysical) Filtered GPS Spectra Raw SLR Spectra Jim Ray (NOAA/NGS), Tonie van Dam (U. Luxembourg), Zuheir Altamimi (IGN), Xavier Collilieux (IGN) • stacked spectra (Lomb periodogram) for 167 IGS sites with >200 weekly points during 1996.0 - 2006.0 • using non-linear residuals from the ITRF2005 combination • smoothed using boxcar filter with 0.03 cpy window • spectra are very similar for all 3 components • harmonics seen near 1 cpy up to at least ~6 cpy • frequencies for harmonics >2 cpy are definitely not at even 1.0 cpy intervals • compare observed spectral peaks with 1.0 intervals (marked with red dashed lines) • contributions also probable at 1.0 & 2.0 cpy due to geophysical signals & technique errors
8. GPS “Draconitic” Year 4. Compare to VLBI Spectra 6. Compare to Filtered Surface Water Loading – Remove Seasonal Fits • use ITRF2005 non-linear residuals for 21 sites with >200 daily sessions • only clear peak is ~1 cpy in H residuals • no sub-seasonal harmonics seen • spectra are dominated by white noise • insufficient sensitivity to detect harmonic signals if they are present (e.g., geophysical) • the 1.039 cpy frequency of the GPS harmonics does not match any expected alias • also does not match any geophysical frequency • however, U. Hugentobler [private communication, 2006] suggested a possible explanation • he pointed out that the GPS harmonic has the same period as the GPS “draconitic” year • 1.039 ± 0.005 cpy corresponds to period of 351.5 ± 1.7 days • a GPS year is the time (viewed from the Earth) for the Sun to return to the same point in space relative to the GPS orbital nodes • GPS nodes drift in space primarily due to effect of the Earth’s oblateness, about -14.16 º/year • so “GPS year” = 351.4 days, corresponding to a frequency of 1.0393 cpy • possible mechanisms could involve constraints of GPS orbit model parameterization • also possible that unknown site position biases are modulated by GPS year due to varying geometry • remove large seasonal peaks before computing stacked, smoothed spectra for same 167 IGS sites • hydrology model apparently possesses N * 1.0 harmonics • but no sub-seasonal harmonics seen at GPS frequencies Filtered Hydrologic Loading Spectra 2006 AGU Fall Meeting. 14 Dec. 2006, San Francisco – Poster #G43A-0985 Raw VLBI Spectra 9. Conclusions • when stacked, spectra of GPS position time series show sub-seasonal harmonics, up to at least ~6 cpy • observations are consistent with overtones of a fundamental tone of 1.039 ± 0.005 cpy (or 351.5 ± 1.7 day period) • in addition, usual seasonal signals (1.0 & 2.0 cpy) are prominent • spectra are similar for all 3 N,E,H components • flicker noise describes background spectra down to periods of a few months • position residuals become whiter at shorter periods • comparisons with SLR & VLBI are inconclusive because of small sample of sites & higher noise • annual variations seen in all 3 SLR components & in VLBI heights, but no harmonics • check of geophysical fluid loadings fails to reveal source for sub-seasonal harmonics 7. Compare to Filtered Non-tidal Ocean Loading – Remove Seasonal Fits • remove large seasonal peaks before computing stacked, smoothed spectra for same 167 IGS sites • no clear evidence for sub-seasonal harmonics, except maybe near 6.2 cpy 5. Compare to Filtered Atmosphere Pressure Loading – Remove Seasonal Fits Filtered Ocean Loading Spectra • remove large seasonal peaks before computing stacked, smoothed spectra for same 167 IGS sites • no clear evidence for sub-seasonal harmonics, except maybe near 3.1 cpy 10. Consequences Filtered Atmosphere Loading Spectra • rather than a geophysical cause, GPS technique errors are suspected as underlying source of non-seasonal harmonics • if so, mechanism appears to be related to position of GPS constellation • could involve GPS orbit modeling • or possible site position biases are modulated by GPS year variation (i.e., apparent position of constellation relative to sites) • such geometrical biases have been demonstrated due to antenna near-field reflections • beating of 1.0 & 1.039 cpy tones should generate beat modulations at 0.039 & 2.039 cpy – or periods of 25.6 years & 179.1 days • long-period beat modulation could bias velocity estimates if samples are not collected often enough • fits for seasonal geophysical signals will be contaminated by 1.039 cpy harmonic unless geophysical effect is much larger • further research is required to investigate direct links between these effects