Download
1 / 27
270 likes | 453 Vues
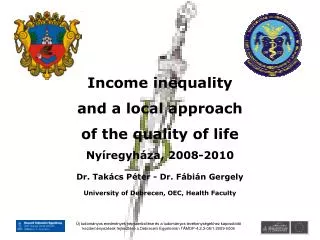
Income inequality and a local approach of the quality of life Nyíregyháza, 2008-2010. Dr. Takács Péter - Dr. Fábián Gergely. University of Debrecen, OEC, Health Faculty. Új tudományos eredmények népszerűsítése és a tudományos tevékenységekhez kapcsolódó

E N D
Income inequality and a local approach of the quality of life Nyíregyháza, 2008-2010 Dr. Takács Péter - Dr. Fábián Gergely University of Debrecen, OEC, Health Faculty Új tudományos eredmények népszerűsítése és a tudományos tevékenységekhez kapcsolódó kezdeményezések fejlesztése a Debreceni Egyetemen TÁMOP-4.2.3-08/1-2009-0006
Quality of life in Nyíregyháza- household research, 2008-2010 This survey is a part of a research series that started in 2008. The starting point of the survey is the nationwide, TÁRKI ‘Háztatásmonitor’ research which was started in 1992. We used this national survey at local level. We studied the population of Nyíregyháza. This is a follow-up study. We studied the same households in 2008 and 2010 … (we hope 2012 …). We used almost the same questionnaire in these two years. The sample size was 2000 households. The survey involved nearly 5000 inhabitants. The results can be used for tenders, for situation assessment. The results can be used to make more effective use of resources. The Blocks of the questionnaire were the following: State of households, Economic Activity, Health Status, Social Relationships, Status of elderly, Support systems In the lecture we deal with the following topics in details: 1. Income inequality. 2. Local measure of the quality of life. The data processing is not complete - from the year 2010 national data are still missing.The analysis will be completedwith this part.
GINI = A / (A + B) A GINI = 0.0 teljes egyenlőség GINI = 0.3 részleges egyenlőtlenség B GINI = 1.0 teljes egyenlőtlenség We used the following indicators and parameters: The first topic is the in this lecture. Income Inequality • Net income and spatial relations and temporal relations. • Per capita income and the territorial conditions and temporal relationships. • Minimum, maximum, median, mean, range, standard deviation, variance, etc. • Quantile: quartile, quintile, decile, etc. • Gini coefficient, Robin Hood Index (Hoover index), Éltető index. • and so on
On this page we can see the Income inequalities Precisely/Exactly: distribution of household income per capita under the income deciles In 2008. We can see the average income of each decile. in Hungary, in Nyíregyházaand in Huszártelep (poor and undeveloped part of Nyíregyháza). We can see that Huszártelep does not lag behind in case of income,but the upper income categories are missing. Thus, the overall average income is naturally less in this quarter. The average income in Nyíregyháza in 2008 was 177.000 HUF/month. The average income in Nyíregyháza in 2010 was 184.047 HUF/month. The difference was 7.047. but It did not follow the growth of inflation. This represents a slight decrease in real income. We calculate the GINI coefficient This (Gini coefficient) measures the distribution of income inequality. 0 represents perfect equality.If we want to illustrate this: Each man will receive the same salary.1 denotes the total inequality.If we want to illustrate this: Only one person will receive all payments. The Gini coefficient was 0.28in 2008 and 2010. What does this mean in connection with/in relation to the European Union and to the World? Income inequalities - Per capita household income distribution under the income deciles, 2008. Az egyes decilisek átlagjövedelmei (Ft) The average income of each decile. 2010 20,0 0,290 Average income (2008): 177.000 Average income (2010): 184.047 Hungary: 2007. Source: TÁRKI, Nyíregyháza: 2008, our survey.
GINI (*100) – European Union (2004), country of world We can see the Gini values of different countries in these tables. Hungary and Nyíregyháza are located in the middle of the table of the European Union. See the left side of the slide. and Hungary is the 122nd among the 134 countries. See the right side of the slide. The U.S. (United States) is the 42nd. Thus we can say that the distribution of income in Hungary is more even. Source: 2004, 2007, 2008 Eustat, wiki, our research
Empirical estimate rates of income categories Hungary 2007-2009, % We study the middle class The categories: wealthy, upper-middle class, middle class, lower-middle class, poor This chart shows data for two years (2007 and 2009) in Hungary. We can see the elimination/depletion of the middle-class. The relative share of rich and poor is increasing. This means polarization in the population in the country. We can see it by GINI index too. upper-middle class lower-middle class poor wealthy - 5,0 1,0 2,0 0,0 2,0 Source: Hungary: 2007, 2009, TÁRKI
Empirical estimate rates of income categories Nyíregyháza, 2008-2010,% middle class We can observe the same in Nyíregyháza In 2008 and 2010. Remark/Note: Here we can see that Nyíregyháza have similar trends to the country. We can see the elimination / depletion of middle-class. The relative share of rich and poor is increasing. We believe that this is partly due to economic crisis. lower-middle class upper-middle class poor wealthy 0,8 1,3 - 3,7 - 0,4 2,0 Source: our survey
The second main theme of the performance is Local measure of the quality of life The FT Index http://myviewsdrift.blogspot.com/2010/04/quality-of-life.html „The term quality of life is used to evaluate the general well-being of individuals and societies.” - wikipedia First We present the indicators that are used by researchers and analysts. Secondly We want to show the steps of our research process and present our further goals. We present two (four) models (2 in 2008 and 2 in 2010). Σ http://www.maps-inc.org/events/international-symposium-on-human-rights-and-quality-of-life-of-the-portuguese-speaking-communities-in-the-united-states-of-america-and-canada/
Indexes of the quality of life Questions of the quality of life havebeen focused on developed societies at the end of the twentieth century. The basic idea is: The main objective of the whole society should be to increase the human quality of life, constantly. These require examination instruments and methods.So we can increase the objectivity of the researches.We can classifyquality of life indicatorsin the following ways. A, Objective and Subjective indicators Per capita GDP (Gross domestic product) Life expectancy Healthy Life Years Personal satisfaction with the quality of life, with the health, with the economic status … B, Profession-specific approach Main areas where the studies startedare economics, sociology, psychology, health sciences, … Complex indicators were formed from these indicators. Indicators that we developed are complex indicators, based on sociology.
Local measureof the qualityof lifeNyíregyháza, 2008-2010 We started the development of our local quality of life indicator in 2010.Our base was a research ‘Háztatáspanel’ - the above mentioned. We developed two models. I. The first model is a simple aggregate model. This is the summary of the involved variables. The main results of this model is to develop and fix a variable-set– 23 questions. We used this variable-set in the second model. II. The second model was based on the Rahman-model (see quality of life literature). The Rahman-model uses eight groups of questions. Our 23 questions can be classified in seven Rahman-categories. We used principal component analysis (PCA) to establish the weight of the groups. We develop complex indicators(QLI_1, …, QLI_4 = FT Indexes) with weighted sum. Remarks:The difference of the calculated weights are very smallin the two years.
2008. 1. model: QLI_1model summary The research steps were the following: -selection of 30 questions -re-encoding - increasing human values represent increasing points -creating descriptive statistics -exclude three variables - many missing answers -Factor Analysis - exclude three variables - very different from the group -index calculation: summation – QLI_SUM_1 or QLI_1 We can see the descriptive statistics of the index on the right. We can see the histogram of the index on the left. The distribution of the QLI_1 variable is not a normal distribution Kolmogorov-Smirnov test p=0.000 and Saphiro-Wilk test p=0.000. The distribution is stretched to the right so we can understand the lack of normality. Now comes further investigations in relation to this index.
QLI_1. – ‘sub-area’ We can divide Nyíregyháza 14 sub-area. We investigated the average of the variable QLI_1 in these sub-areas. We used analysis of variance (ANOVA) to compare the averages. The analysis shows that the averages do not differ p=0.283 But remember The distribution of the QLI_1 variable is not a normal distribution The Kruskal-Wallis test does not require the normality of the variables. The Kruskal-Wallis test indicates a detectable difference p=0.022 The Kruskal-Wallis test uses rank numbers: The first is „Jósaváros II.” – new rich area of Nyíregyháza. The last is „Huszártelep” – poor area of Nyíregyháza.
QLI_1. – ‘rich’ We examined the perception of individual and family rich and the distribution of the QLI_1 index. The results are shown in this slide. We see, "the growing assessment of economic status" involves "increasing quality of life". The results of the statistical analysis are the following: A, ANOVA (Analysis of Variance) – no difference – p=0.279 B, Kruskal-Wallis test – difference – p=0.000 Analysis B, is the correct analysis due to lack of normality. The categories: wealthy, upper-middle class, middle class, lower-middle class, poor
QLI_1. – ‘employment’ We investigate the employment classification in the same way. The results are shown in this slide. The results of the statistical analysis are the following: A, ANOVA (Analysis of Variance) – no difference – p=0.547 B, Kruskal-Wallis test – difference – p=0.011 Analysis B, is the correct analysis due to lack of normality. The „disability pensioners” show the lowest quality of life.
QLI_1. – ‘language’ We investigate the „language knowledge” the same way. Those who speak foreign languages has a higher quality of life. t-test: p=0.025 Mann-Whitney-test: p=0.000
QLI_1. – ‘car’ We investigate the question „Do you have a car?” the same way. Those who have a car have a higher quality of life. t-test: p=0.006 Mann-Whitney-test: p=0.000
2010. 2. model: QLI_2model summary We develop a similar model to the 2010 data. The histogram of QLI_2 index is on the slide. Since the reduction in number of elements was too large we have not continued this way for the analysis We developed a new model – the Principal Component Analysis based model. Ø
2008. 3. model: QLI_3model summary We explained the steps of model development previously. so here we discuss the descriptive statistics of model (QLI_3 or FT Index). We can seethe descriptive statistics and the histogram of the index in the slide. The number of cases was 1675. The average quality of life is 6.09. The distribution of the QLI_3 variable is a normal distribution. Kolmogorov-Smirnov test p=0.200 and Saphiro-Wilk test p=0.253 We can see the familiar bell-shaped curve in the diagram.The results of this model are more accurate.
QLI_3. – ‘sub-area’ We investigated the average of the variable QLI_3 in Nyíregyháza’ sub-areas. We used analysis of variance (ANOVA) to compare the averages. The analysis shows that the averages differ p=0.001 By the post-hoc analysis, Huszártelep has a significantly lower quality of life index. 2008. QLI_1
2010. 4. model: QLI_4model summary The PCA-based model in 2010 has good properties, just like in 2008. The distribution of the QLI_4 variable is close to normal distribution. Kolmogorov-Smirnov test: p=0.161 and Saphiro-Wilk test: p=0.023. The number of missing cases has grown highly. This is a warning sign concerning the following sampling. We will take care of sampling in 2012.
QLI_4. – ‘sub-area’ We investigated the average of the variable QLI_4 in Nyíregyháza’ sub-areas. We used analysis of variance (ANOVA) to compare the averages. The analysis shows that the averages differ p=0.037 By the post-hoc analysis, Huszártelep has a significantly lower quality of life index, again.
QLI_3 and QLI_4. – ‘sub-area’ We can see the second (PCA-based) model (QLI_3, QLI_4) on the same slide: We can observe an increase of quality of life (standardized) in four parts of the city (from 14). The greatest reduction isin the following areas: Jósaváros II., Huszártelep, Bokortanyák, Újtelekiszőlő. We also examine the underlying causes. but We think we should pay attention to internal migration, in addition the economic crisis.
QLI_3. and QLI_4. – ‘rich’ We compared the distribution of the perception of Individual and family rich in the two years. The quality of life of the poor (-0.19) and the rich (-0.2) is decreased. The middle class has not changed fundamentally. Quality of life in upper-middle class has increased. The categories: wealthy, upper-middle class, middle class, lower-middle class, poor
QLI_3. and QLI_4. – ‘education’ We investigated the relationship between „education” and „quality of life”. We see, "the growing of personal education" involves "increasing quality of life". We can observe small changes in the city: The quality of life those have completed secondary education has grown. grammar school university college vocational school elementary school
QLI_3. and QLI_4. – ‘employment’ We examine theemployment classification inthe same way. Here we can see even greater changes. We can see significant reduction in quality of life in many layers.
QLI_3. and QLI_4. – ‘religion’ This figure presents the relationship "relation to religion" and "quality of life." Change in two years is very high. The religious people's quality of life has increased. We are researching the causes ... the other believesateist ? uncertainty in religion religious people
This was the Income inequality and a local approach of the quality of life - in Nyíregyháza, in 2008-2010 The current studies demonstrate the utility of the new FT quality of life index. We have a lot of new research questions and We have some small answer. We have more plans: 1. We want to develop "percentage form" of the index. 2. We want to explore the driving forces of change. 3. We want to do/survey on the questionnaire in other cities. Thank you for your attention!