Download
1 / 32
320 likes | 467 Vues
SOCIALI S ATION ASPECTS OF UNIVERSITY STUDENTS : A Comparative Study of Modes and Frequency of Attendancy to Social Activities and the Socialisation Level of Student Teachers. Prof. Dr. Rauf YILDIZ Prof. Dr. Meh m et Durdu KARSLI Onsekiz Mart University. Purpose

E N D
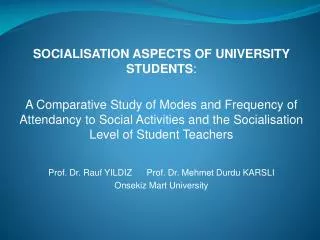
SOCIALISATION ASPECTS OF UNIVERSITY STUDENTS: A Comparative Study of ModesandFrequency of AttendancytoSocial Activities andtheSocialisation Level of Student Teachers Prof. Dr. RaufYILDIZProf. Dr. Mehmet DurduKARSLI Onsekiz Mart University
Purpose To determine themodesandfrequency of attendancyto social activities andsocialisationlevelof student teachers studying at departments of Primary School Education and Computer and Instructional Technology Education (CITE). Sample 260studentteachers from the third and fourth gradesof therelevantdepartments ofOnsekiz Mart University,Faculty of Education during 2009-2010 school year.
Data GatheringMethods Datawerecollected via a widely used 5-point likert typequestionnaire, namelySocial Activity Questionnaire (SAQ). Thequestionnairecomprised4 parts. Thefirstpartcontainedquestionsregardingindependentvariablessuch as department, genderandgrade. Thesecondpartcontained 5 questionscocerningthemodes of socialactivities, thethirdpartcontained 5 questionsconcerningthefrequencylevel of socialactivities, andthefourthpartcontained 34 questionsconcerningthesocialisationlevel of studentteachers.
Data AnalysingMethods The data were analyzed usingseveralstatistical methodssuch as frequency distribution, Mann Whitney U test and MANOWA.
Table 1: TheCronbachAlphaValue of theItems Table 1 showsthattheCronbach Alpha value of thequestionnaire is 0,77. Thisvalue is over 0,70 so it can be saidthatthereliabilitylevel of thequestionnaire is at aceptablerange. FİNDİNGS AND DİSCUSSİON
FİNDİNGS AND DİSCUSSİON A) FindingsconcerningtheIndependentVariables 1. The Distribution of theSampletotheDepartments Table 2: TheDistribution of theSampletotheDepartments Table 2 showsthat50,3 % of thesubjectsarefromthedepartment of PrimaryEducationand 49,7 % of themarefromthedepartment of CITE (almostequal).
2. TheGenderDistribution of theSampletotheDepartments Table3: TheGender Distribution of theSampletotheDepartments Table 3 showsthat in total, 45 % of thesubjectsaremale, 55 % arefemale. Thisproportioncencerningthedepartments is likethat: Primarydepartment; 45.9 % male, 54.1 % female; CITE 58.2 % male, 42.8 % female.
3. TheDistribution of theSubjectstotheGrades Table 4: TheDistribution of theSubjectstotheGrades Tablo 4 showsthatin total 54.2 % of thesubjectsare 3rd and 45.8 % are 4th gradestudents. Inregardtothedepartments: Primary; 66.2 % 3rd and 33.8 4th grade, CITE 51.9 % ’u 3rd and 48.1 4th gradestudents.
B) FindingsconcerningthedependentVariables 1- Modesof AttendancytoSocialActivities Table5: TheModes of AttendancytoSocialActivities
Table 5 showsthatsubjectsprefertoattendtosocialactivitieswithfriendsorindividuallywithoutprogramming it. Thisfindingmay be interpretedlikethis; universitystudentsattendsocialactivitiestoenjoythemselvesandspendtheirfree-time spontaniouslyratherthansharingtheirexperiencesandcollaborating on someprogrammedprojects. It is not a desirablemode.
2. TheAttendanceFrequency of SubjectstoSocialactivities Table 6:TheAttendanceFrequency of SubjectstoSocialactivities
Table6 showsthat; 1- Most of thestudents (60,3 %) attendsocialactivitiesoccasionallyandonlyquitesmallpropoprtion (3 %) of themattendsocialactivitiesEachweekdays. 2- Theproportionsconcerningbothdepartments’ studentsattendencytosocialactivitiesarealmostequalto general proportions. 3- Thisfinding is inline withthepreviousfinding, i.e. İt is not a desirablemodeandfrequency.
3. DifferencesBetweenTheSocialisationLevelof Primaryand CITE Students Table 7: TheSocialisationLevel of Primaryand CITE Students
Table7 showsthat; There is a significantdifferencebetweenthesocialisationlevels of students of PrimarySchoolandComputerandInstructional Technologies Education (CITE) departments in regardtomost of theitems (29 out of 34). Thedifference is in favourof students’ of Departmentof PrimarySchoolEducation, i.e. Theirsocialisationlevel is higherthantheotherdepartment’sstudents. Thereasonbehindthisresultmay be interpretedlikethis; Students of theDepartment of PrimarySchoolEducationareusuallymore in contactwiththesocietyandtheschoolsthanthestudents of theComputerandInstructional Technologies Education (CITE).
4. DifferencesBetweenTheSocialisationLevel of 3rd and 4th Grades’ Students Table 8: TheSocialisationLevel of 3rd and 4th Grades’ Students
Table8 showsthat; There is a significantdifferencebetweenthesocialisationlevels of 3rd and 4th gradestudents (21 out of 34). Thedifference is in favour of the 4th gradestudents i.e. Theirsocialisationlevel is higherthanthe4th gradestudents. Thereasonbehindthisresultmay be interpretedlikethis; Theremay be a correlationbetweenthesocialisationlevelandeducationlevel. Thisissueneedsto be searchedfurther.