10 Nov. 2010, TAS-I Progress Meeting, Torino
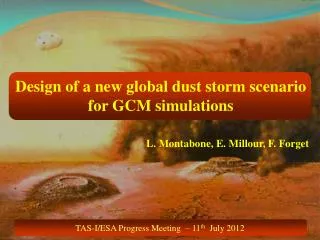
Regional and local dust storm scenarios designed to simulate possible hazardous conditions at the Exomars 2016 Meridiani reference landing site. General Circulation Model runs.

10 Nov. 2010, TAS-I Progress Meeting, Torino
E N D
Presentation Transcript
Regional and local dust storm scenarios designed to simulate possible hazardous conditions at the Exomars 2016 Meridiani reference landing site.General Circulation Model runs Prepared by E. Millour and F. ForgetLaboratoire de Météorologie Dynamique,Université Pierre et Marie Curie, Paris, France 10 Nov. 2010, TAS-I Progress Meeting, Torino
2 Flushing storm scenarios Meridiani reference landing site
2 Flushing storm scenarios • A typical regional “flushing storm” as observed by MGS TES around Ls=223°, transposed to the Exomars landing period (scenario S114) • An extreme, geographically similar dust storm, but with doubled optical depth within the storm (Scenario S115)
Implementation of S114 & S115 scenarios in MCD v4.3.ex.4 • Standard MCD scenarios outputs rely on interpolation between datasets 30° apart in Ls. However, all the S* scenarios in MCD v4.3.ex.* built so far were implemented as “perpetual days” (over Ls=240-250°). • Here we have a rapidly changing environment (over 10° of Ls), so we had to adapt the MCD software to use interpolation between 5 datasets spread over the range of Ls=240-250°.
Temperature profiles (at LT=14) at Meridiani Landing Site • The increase in dust leads (as expected) to an increase of atmospheric temperatures as the dust storm develops.
Icarus, Volume 201, Issue 2, p. 504-516 (2009) • Scenarios inspired by Maattanen et al. 2009 • Study using the OMEGA (near infrared mapping) and PFS instruments (Thermal sounding) • An optically thick, local dust storm centered at 3° S, 24.7° E, at Ls = 135° and 1.30 p.m. local time. • The same exact area was observed 3 days before the local dust storms
OMEGA observations of the VERY local dust storm (Maättänen et al. 2009) 9.90 7.5 5.0 2.5 0.0 Dust optical depth
Temperature cross-sections Before the storm During the local storm (Mäattänen et al. 2009)
Temperature profile compared to 1D modeling suggest that the dust is vertically confined near the surface (Maättänen et al. 2009)
Local dust storm scenario in the GCM • Dust optical depth in confined local dust storm with tau=10 (S118 scenario), and tau=0.5 “background” (as in S101 scenario). • Storm centered at longitude -3°E and -2°N (radial extent of 4°).
Local dust storm scenario in the GCM • Cross-section of the confined local dust storm with tau=2 (S116 scenario), and tau=0.5 “background” (as in S101 scenario). • Storm vertical extension is set to 11 km.
Implementation of local dust storm cases in the GCM and the MCD • At GCM (and MCD) resolution (5.625°x3.75° lonxlat), the local storm spans the 4 grid points located at longitudes 0°E and -5.625°E and latitudes 0°N and -3.75°N. • Runs were made over 2 sols (typical time scale of such events, thus there are no statistics (RMS of variables) of fields in the MCD for scenarios S116, S117 and S118. • As for other specific v4.3.ex.* scenarios (except flush storms), these are implemented as “perpetual days” in the MCD (over Ls=240-250°).
Temperature profiles over the afternoon • Heating at the top of the dusty layer (11km). • Surface temperature lowered (due to decrease in solar insolation).
Horizontal winds over the afternoon • The impact of the local storm on local winds is present in large scale simulations, but is (obviously) better represented at mesoscale level.